Oil and Natural Gas: Oil remains bullish above $80.00
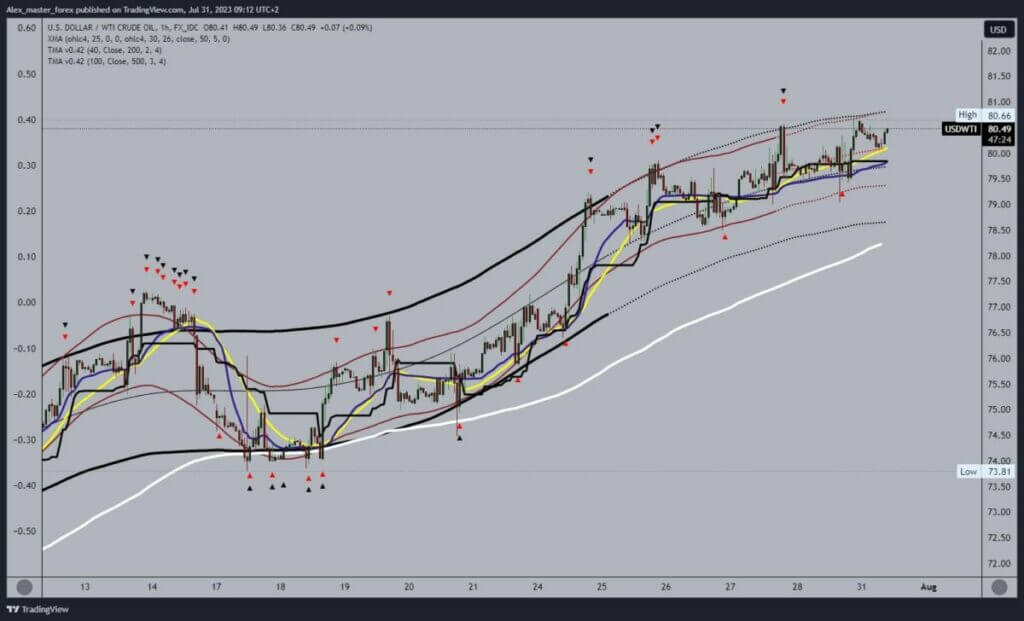
- During the Asian trading session, the price of oil retreated from $80.66 to the $80.00 level.
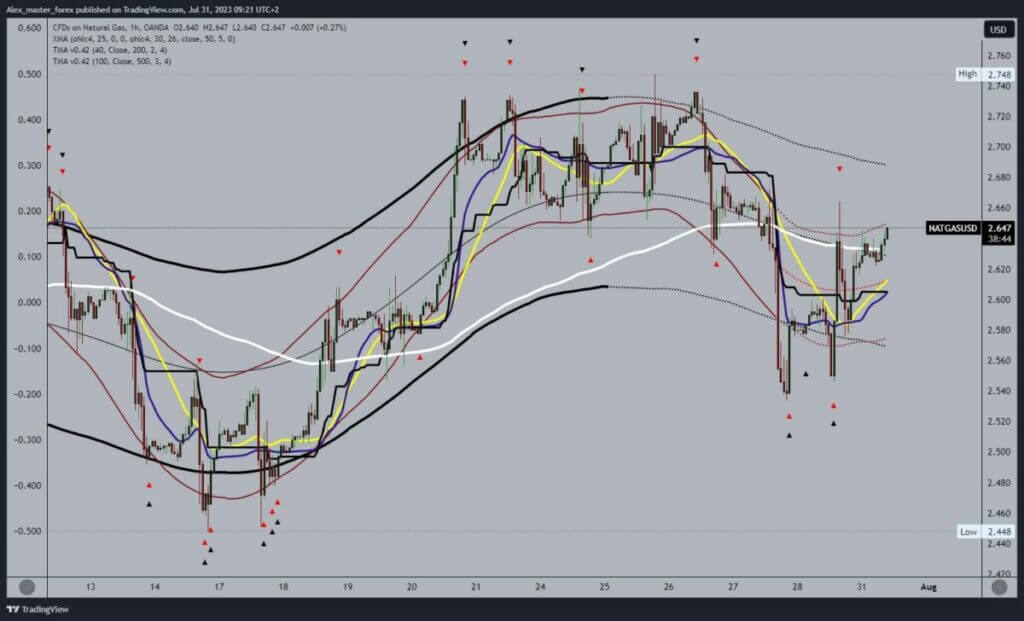
- During the Asian trading session, the price of natural gas moved above the $2.62 level.
Oil chart analysis
During the Asian trading session, the price of oil retreated from $80.66 to the $80.00 level. Now, we see the stoppage of the price pullback and the formation of a potential bottom from which we would start a new rise above the previous high. Potential higher targets are $81.00 and $81.50 levels. July was very favorable for the price of oil in its bullish trend, along with the EMA50 moving average.
We need a negative consolidation and a pullback below the $80.00 level for a bearish option. If we fall below, the next important level is the previous support at the $79.50 level. By breaking the price below it, we would form a new low and thus confirm the bearish option. Potential lower targets are $79.00 and $78.50 levels. Additional price support at the $78.50 level is the EMA50 moving average.

Natural gas chart analysis
During the Asian trading session, the price of natural gas moved above the $2.62 level. A new bullish consolidation and movement of the price above the $2.64 level has begun. In the following, we can expect to test the previous high at the $2.66 level and perhaps make a breakthrough above. Potential higher targets are $2.68 and $2.70 levels. Additional support for the price at the current level is in the EMA50 moving average, which could have a positive effect and push the price even higher.
We need a negative consolidation and a drop below the $2.62 support level for a bearish option. We would soon go down to the $2.60 level and test the support at that level. A price break below would lead to a visit to last week’s support levels. Potential lower targets are $2.58, $2.56, and $2.54.


