Oil and natural gas: Oil recovers to the $73.00 level
- The price of oil encountered resistance at the $74.00 level yesterday.
- The price of natural gas rose to $2.82 yesterday.
Oil chart analysis
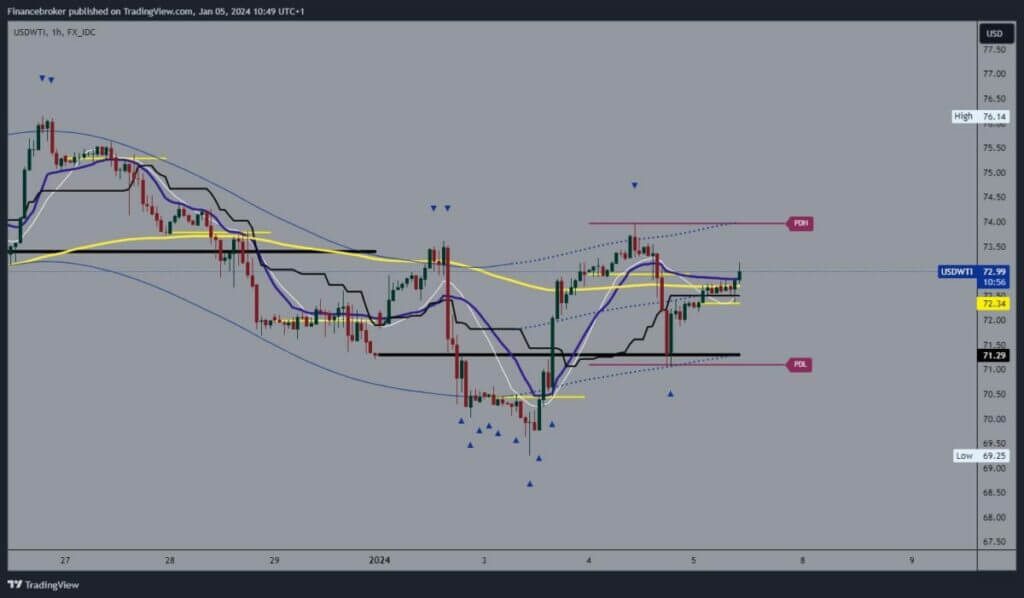
The price of oil encountered resistance at the $74.00 level yesterday. We started to pull back from that level and got support at the $71.00 level. The day before, the oil price fell to $69.25, but it did not happen this time, and we formed a higher low. From that level, we started a positive consolidation that continues today. During the Asian session, the price of oil successfully crossed the barrier at $72.50.
In the EU session, we continue in the same direction, moving up to the $73.00 level. Potential higher targets are yesterday’s levels of $73.50 and $74.00. We need a pullback below the $72.00 support level for a bearish option. We would then expect to see a continuation of the pullback and a retest of yesterday’s support at $71.00. Potential lower targets are $70.50 and $70.00 levels.

Natural gas chart analysis
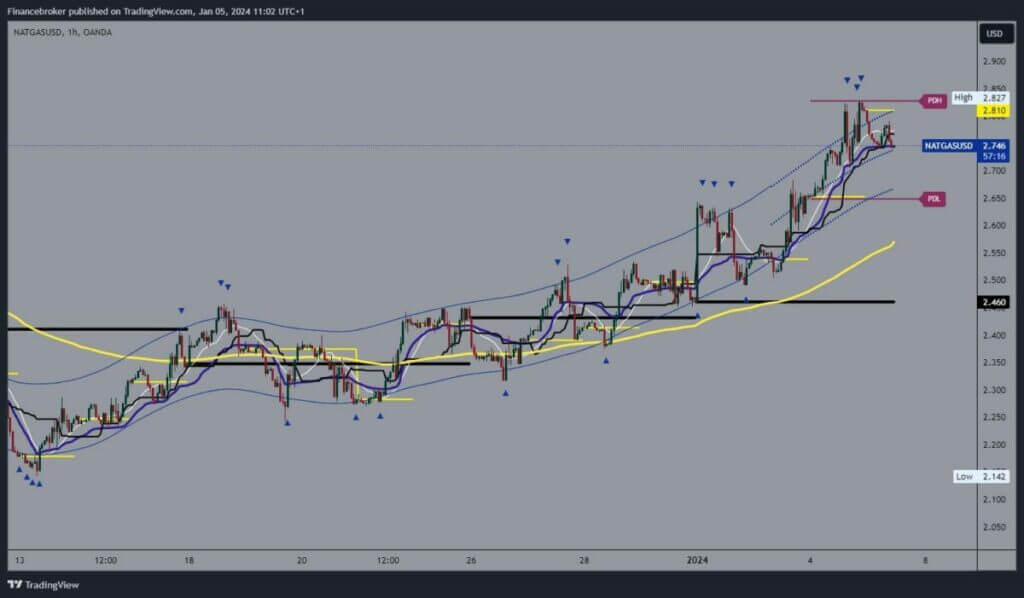
The price of natural gas rose to $2.82 yesterday. This year’s new high was formed, and for now, we are stopping there and making a small pullback to the $2.75 level. We are currently putting pressure on that support level, which could lead to a breakout below and the formation of a new daily low. Potential lower targets are the $2.70 and $2.65 levels.
In addition to falling to the $2.65 level, the price of natural gas would remain in a bullish trend as long as it is above the EMA50 moving average, which is in the zone around $2.60. We need a positive consolidation and a move above the $2.80 level for a bullish option. Then, we need to hold above if we want to see a continuation to the bullish side. Potential higher targets are $2.85 and $2.90 levels.


