Oil and natural gas: Oil price is maintained above 75.00
- At the beginning of the Asian session, the oil price was at $76.25.
- During the Asian trading session, the gas price rose to $2.63.
Oil chart analysis
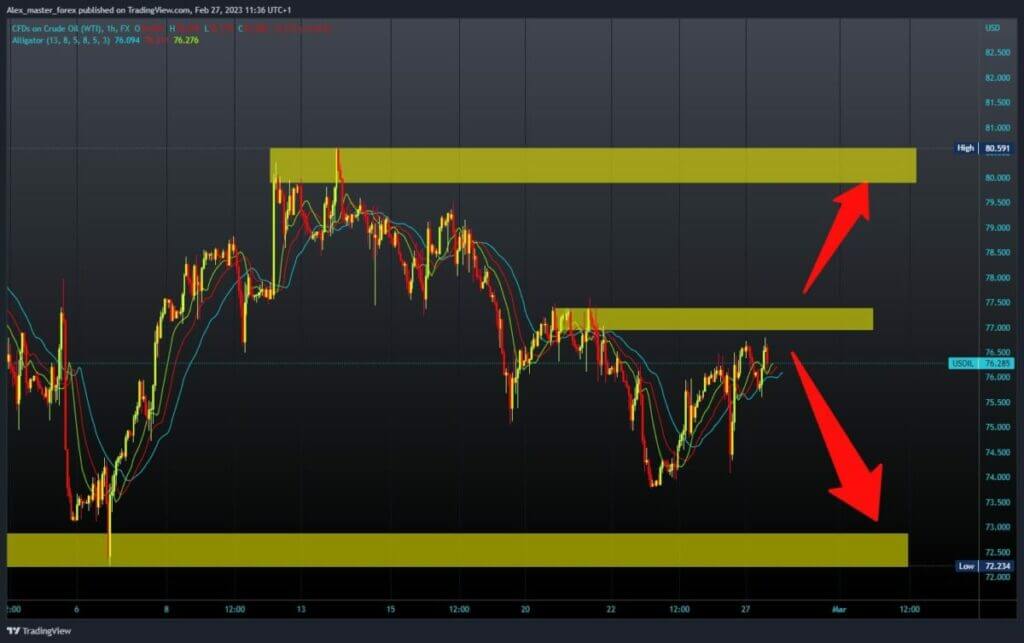
At the beginning of the Asian session, the oil price was at $76.25. A pullback to the $75.50 level soon followed, where the price found support and returned to the starting point again. Now we see that the oil price meets resistance in that zone again and starts a new pullback.
We could soon be at $76.00 and test support at that level. A break below would reinforce the bearish option and further decline in the price of oil. Potential lower targets are the $75.00 and $74.50 levels. For a bullish option, we need a positive consolidation and a move to the previous resistance zone of $77.00-$78.00. If we managed to break through that zone, we would have a chance to see the price recover to $80.00.

Natural gas chart analysis
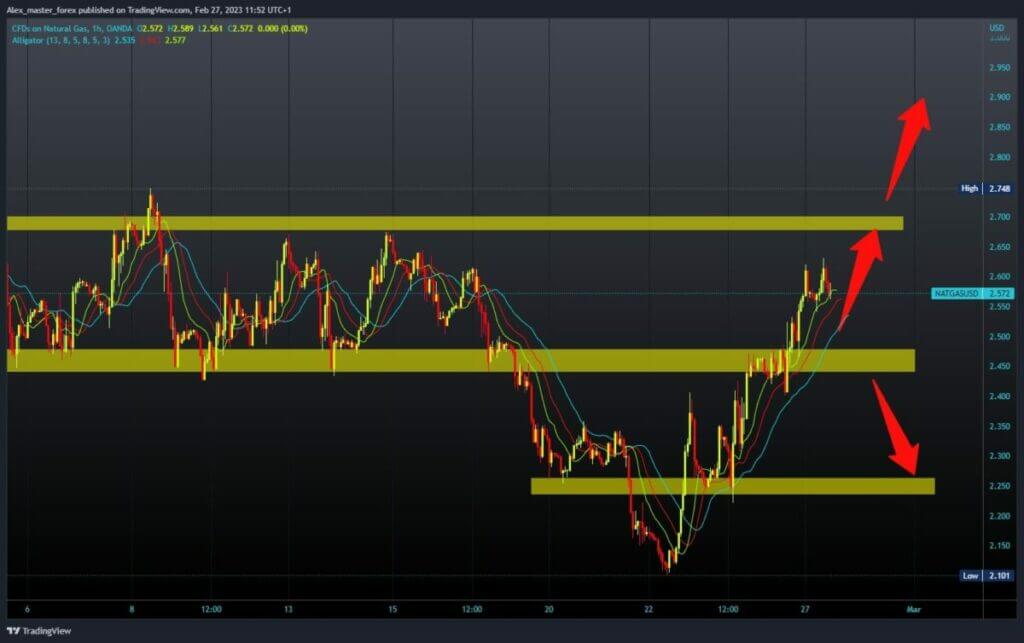
During the Asian trading session, the gas price rose to $2.63. We were there the previous time on February 15. We are now seeing a pullback from that level and are currently at the $2.57 level. For the bullish option, it is important that we stay above $2.50, and with positive consolidation, we start further recovery.
Potential higher targets are the $2.65 and $2.70 levels. For a bearish option, we need a continuation of this minor negative consolidation and a drop to the $2.50 level. A break below would introduce new uncertainty, leading to a possible continuation of the decline in gas prices. Potential lower targets are the $2.40 and $2.30 levels.


