Oil and Natural Gas: Oil has broken above $78.00
- During the Asian trading session, the price of oil strengthened and climbed above the $78.00 level.
- Gas prices rose above $2.80 yesterday for the first time in the last 30 days
Oil chart analysis
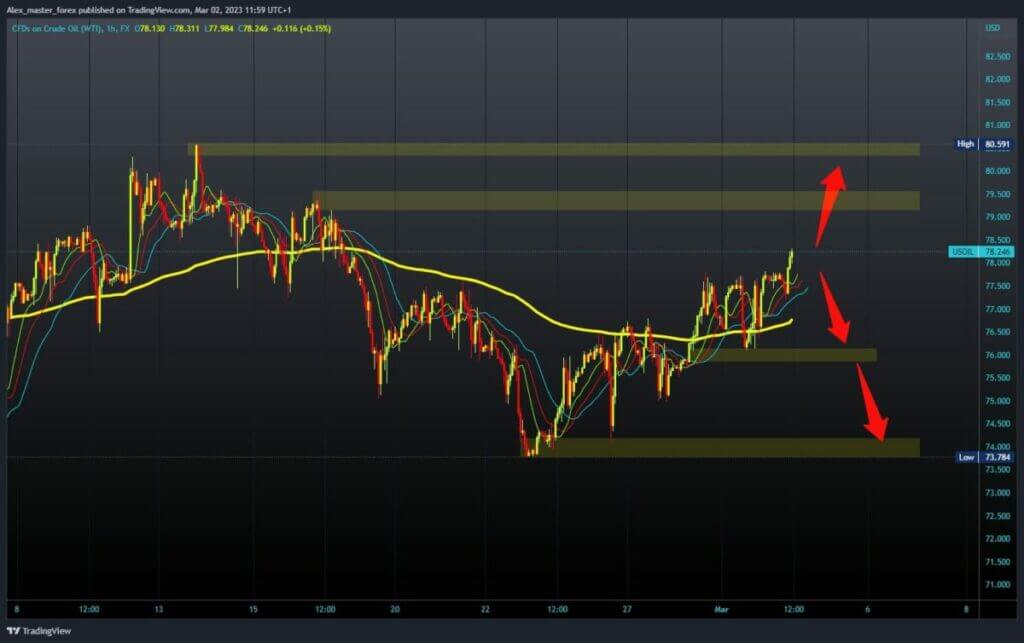
During the Asian trading session, the price of oil strengthened and climbed above the $78.00 level. The bullish impulse also continues to push the price during the European session. The increase in factory activity in China has influenced the strong strengthening of the price of oil. The current oil price is $78.20, and we need to stay above $78.00 to continue the recovery. Potential higher targets are the $79.00 and $80.00 levels.
We need a negative consolidation and a drop to the $77.00 level for a bearish option. Additional support at that level is in the MA50 4h moving average. A drop below could shake the price and send it even lower. Potential lower targets are the $76.00 and $75.00 levels.

Natural gas chart analysis
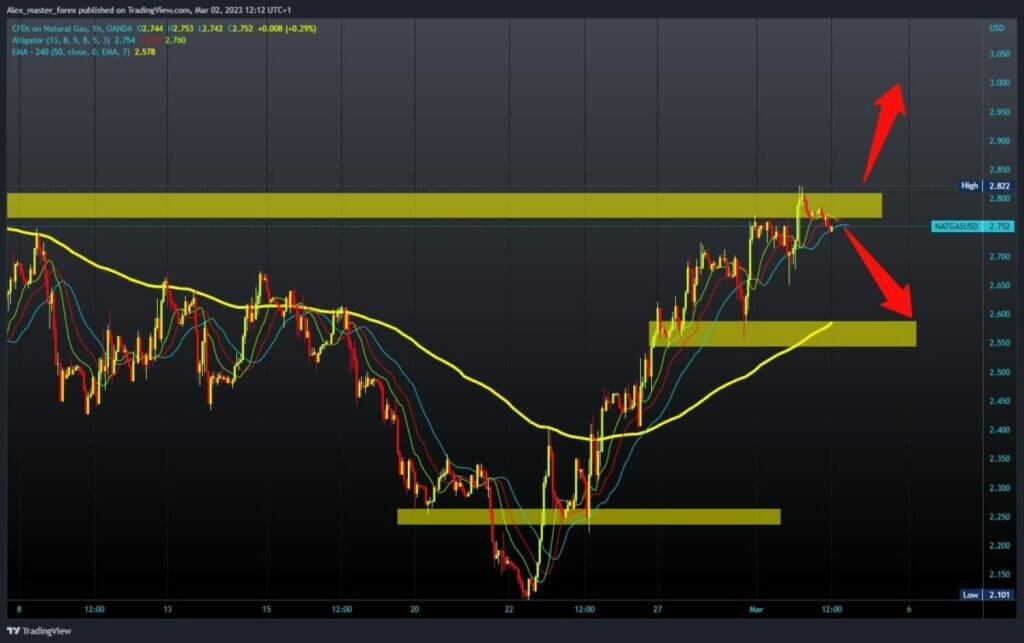
Gas prices rose above $2.80 yesterday for the first time in the last 30 days Price failed to hold at that level, and a pullback followed during the Asian session. The current gas price is $2.75, and we are now looking at $2.70 as the next support level. We need a negative consolidation and a break below the $2.70 level for a bearish option.
After that, we would see a further drop to $2.60, the previous low. We have additional support at that level in the EMA50 moving average. We need a positive consolidation and a move above the $2.80 level for a bullish option. Then it is necessary to keep up there and start further growth with a new impulse. Potential higher targets are the $2.90 and $3.00 levels.


