Oil and Natural gas: Natural gas falls again to $1.62
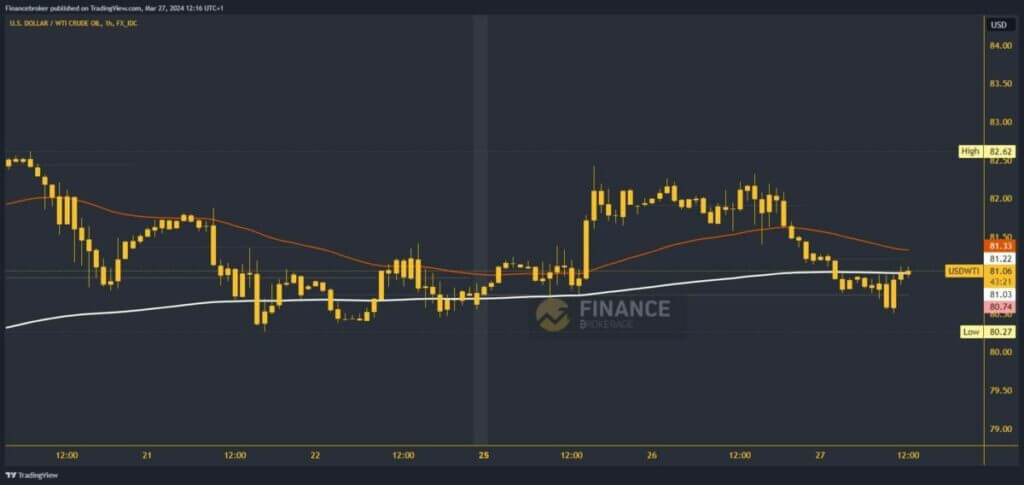
- During the Asian trading session, the price of oil retreated from $81.20 all the way to support at the $80.51 level.
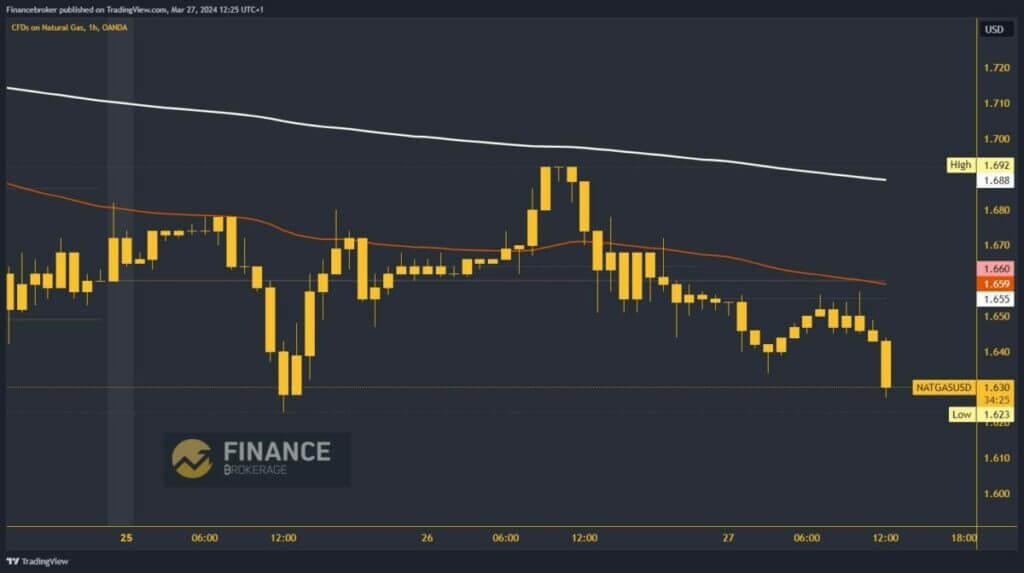
- The price of natural gas is in a bearish trend after yesterday’s jump to the $1.69 resistance level.
Oil chart analysis
During the Asian trading session, the price of oil retreated from $81.20 all the way to support at the $80.51 level. With the new support, we initiate recovery and move back above the $81.00 and EMA200 moving average. We expect to hold here, initiate further positive consolidation, and continue on the bullish side, rising to higher levels. Potential higher targets are $81.50 and $82.00 levels.
If we fail to maintain above the EMA200 and the $81.00 level, the oil price will have to start retreating. We are again looking towards the previous low at the $80.50 level as we will test it. A new presence in that zone could push the oil price to a new daily low. Potential lower targets are $80.00 and $79.50 levels.

Natural gas chart analysis
The price of natural gas is in a bearish trend after yesterday’s jump to the $1.69 resistance level. From there, we started a pullback that continued throughout the Asian trading session, dropping us below the $1.65 level. In the EU session, pressure continues on the gas price, falling to a new daily low at the $1.62 level. Here we are now testing the weekly low price because we were here on Monday, so we recovered.
Now, it would be easy for us to fall to a new low and thus extend the bearish option. Potential lower targets are $1.61 and $1.60 levels. We need to get back above the $1.66 level for a bullish option first. Thus, we go above the weekly open price and increase the optimism for starting a recovery. Potential higher targets are the $1.67 and $1.68 levels. The EMA200 moving average is slightly higher, around the $1.69 level.


