Oil and Natural Gas: Failed to Form a New Higher High
- At the beginning of the Asian trading session, the oil price jumped from $79.60 to $82.10.
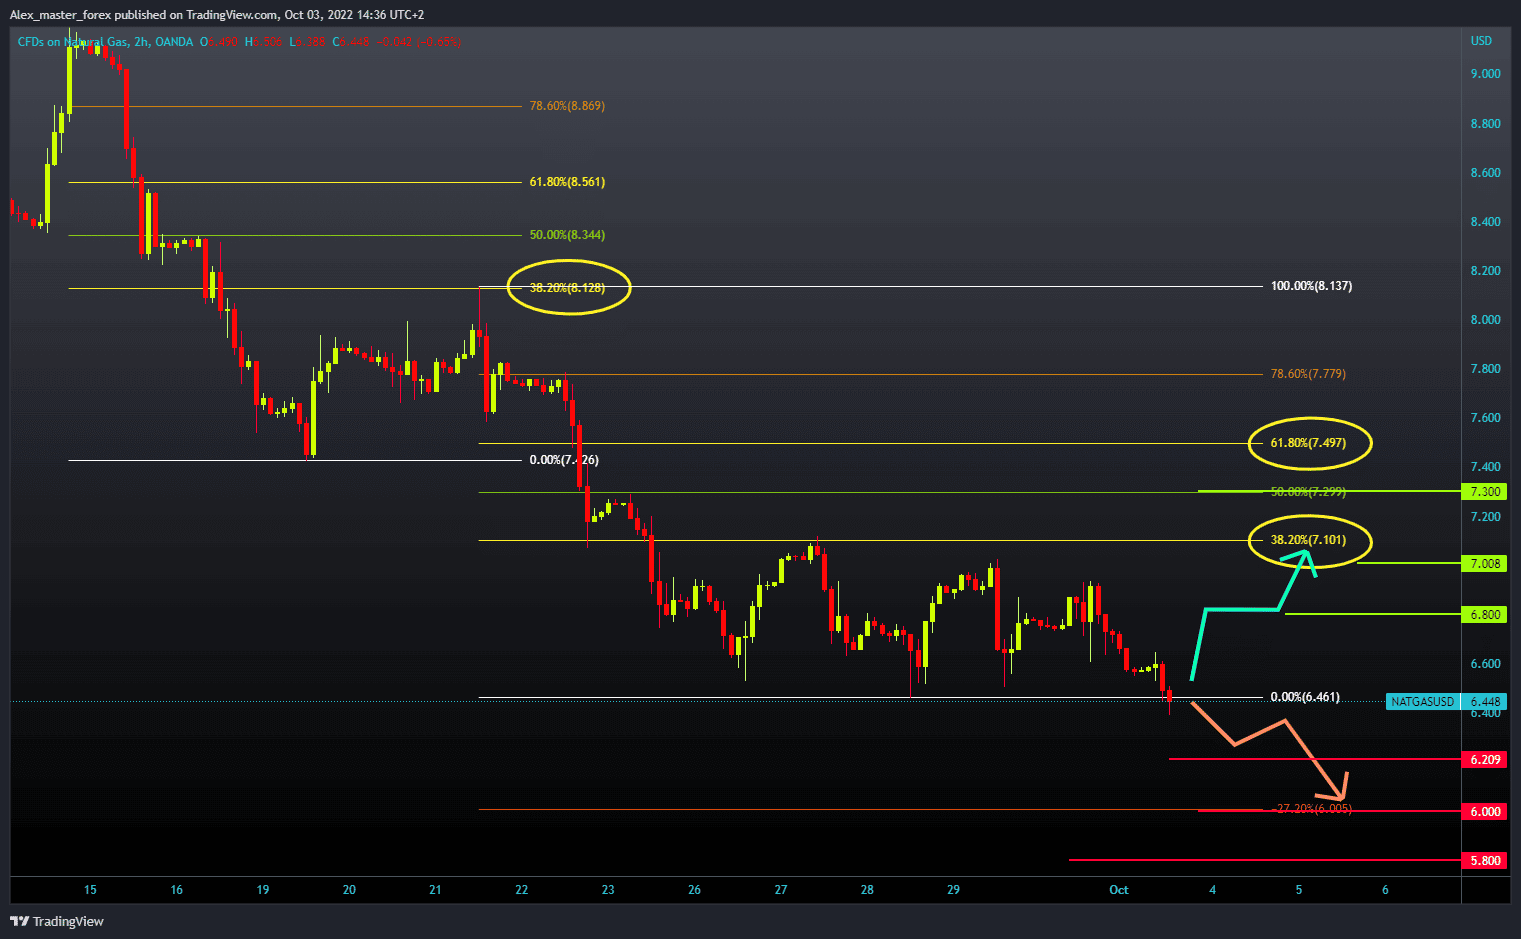
- The price of natural gas continues to put pressure on last week’s $6.46-$6.60 support zone.
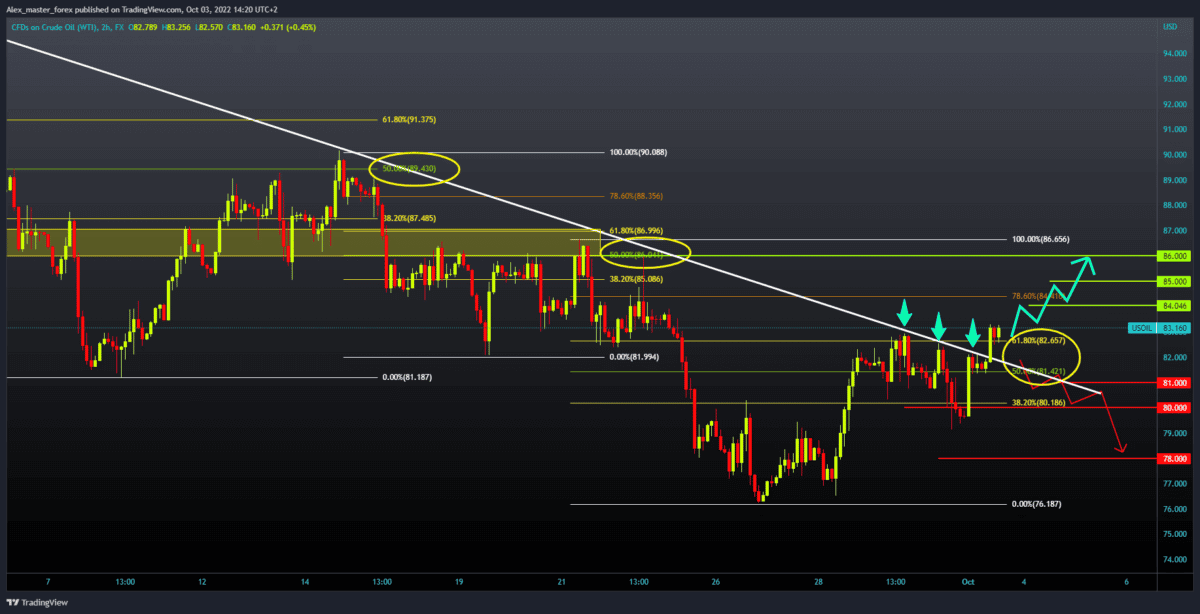
Oil chart analysis
At the beginning of the Asian trading session, the oil price jumped from $79.60 to $82.10. Then we see a consolidation until the beginning of the European session and a new bullish impulse that climbs towards the $83.00 level. Since the market’s opening last night, the price of oil has jumped by 4.15%. It is very important for us that we have seen break prices above the upper resistance line and the 50.0%-61.8% Fibonacci resistance zone. To continue the bullish option, we need to hold above and, with a new impulse, continue towards the next resistance zone. Potential higher targets are $84.00, $85.00, and $86.00, the previous week’s high. For a bearish option, we need the oil price to fall below $81.00 and the 50.0% Fibonacci level. Then the price would test the previous support zone of $79.00-$80.00. A price break below could threaten last week’s $76.00-$77.00 support zone.
Natural gas chart analysis
The price of natural gas continues to put pressure on last week’s $6.46-$6.60 support zone. The price failed to form a new higher high and climb above the 38.2% Fibonacci to better position itself. On the contrary, we see the formation of a new lower high and continuation to the bearish side. We are currently seeing the formation of a new lower low and a drop below last week’s support. Potential lower targets are $6.2 and $6.00 levels. For a bullish option, we need a new positive consolidation and a return above the $6.60 level. After that, we could expect a further continuation of the recovery, first to $6.80 and then to $7.00 and 38.2% Fibonacci.