Oil and Natural gas: Energy Prices Continue to Fall
- The European Union, the G7, and Australia decided to cap the price at $60 per barrel.
- The price of natural gas continues to fall throughout the day.
Oil chart analysis
The European Union, the G7, and Australia decided to cap the price at $60 per barrel. These measures aim to put pressure on the Russian economy. This means that Russian oil, which comes by ship to Europe, can no longer be unloaded in EU ports. If Russia counters, opposes this measure and reduces supplies, oil prices will increase. If he doesn’t, prices will stay the same or even fall.” For now, however, it has yet to be determined for sure how Russia will react to these measures, although the Kremlin has announced that it will not accept a price cap.
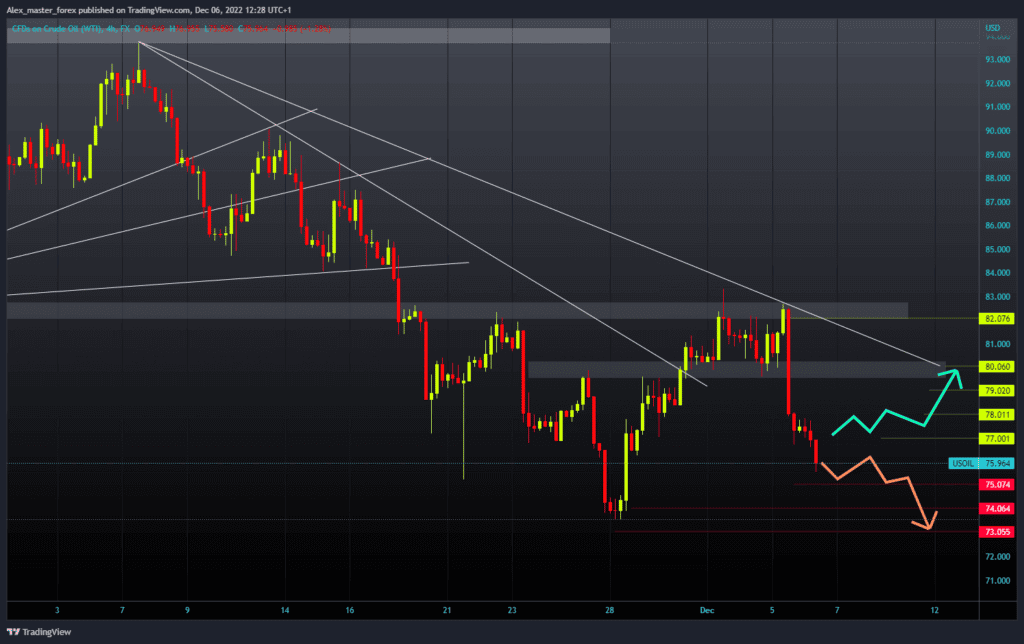
Yesterday, the oil price tried to maintain above the $82.00 level. It succeeded in the first part of the day, only to see a rapid drop to $77.00 in the second part. The price of oil fell by $5.00 in a few hours. During the Asian session, we see that the bearish consolidation has continued. The oil price has continued to slide and is now at the $76.00 level.
If this scenario continues, we could revisit the previous support zone around the $74.00 level. For a bullish option, we need a new positive consolidation and a return above $78.00. Thus, we would form a higher low. After that, we could expect the price to start a further recovery. Potential higher targets are the $79.00 and $80.00 levels.

Natural gas chart analysis
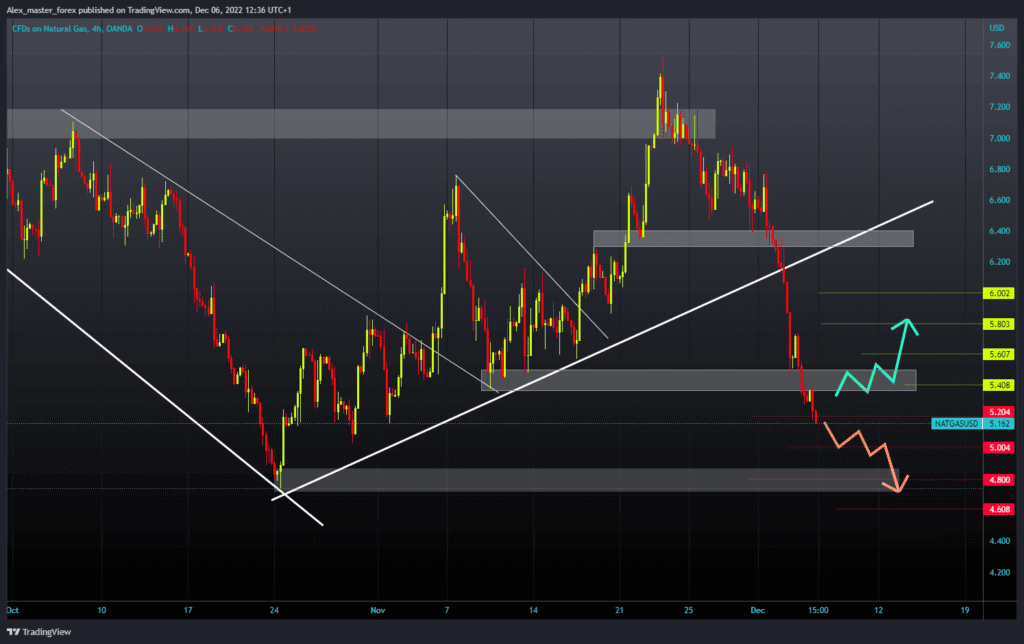
The price of natural gas continues to fall throughout the day. In the Asian trading session, the price of gas tried to hold above $5.40 but was unsuccessful, as we saw a breakout below. We are now already below the $5.20 level, and we could expect a continuation to the $5.00 support level. In further continuation, the gas price would fall to the November support level of $4.80.
For a bullish option, we need a new positive consolidation and a return of the gas price above the $5.40 level. After that, we would form a new higher low on the chart, from which we could start a new bullish recovery. Potential higher targets are the $5.60 and $5.80 levels.


