NZD/JPY analysis for April 16, 2021
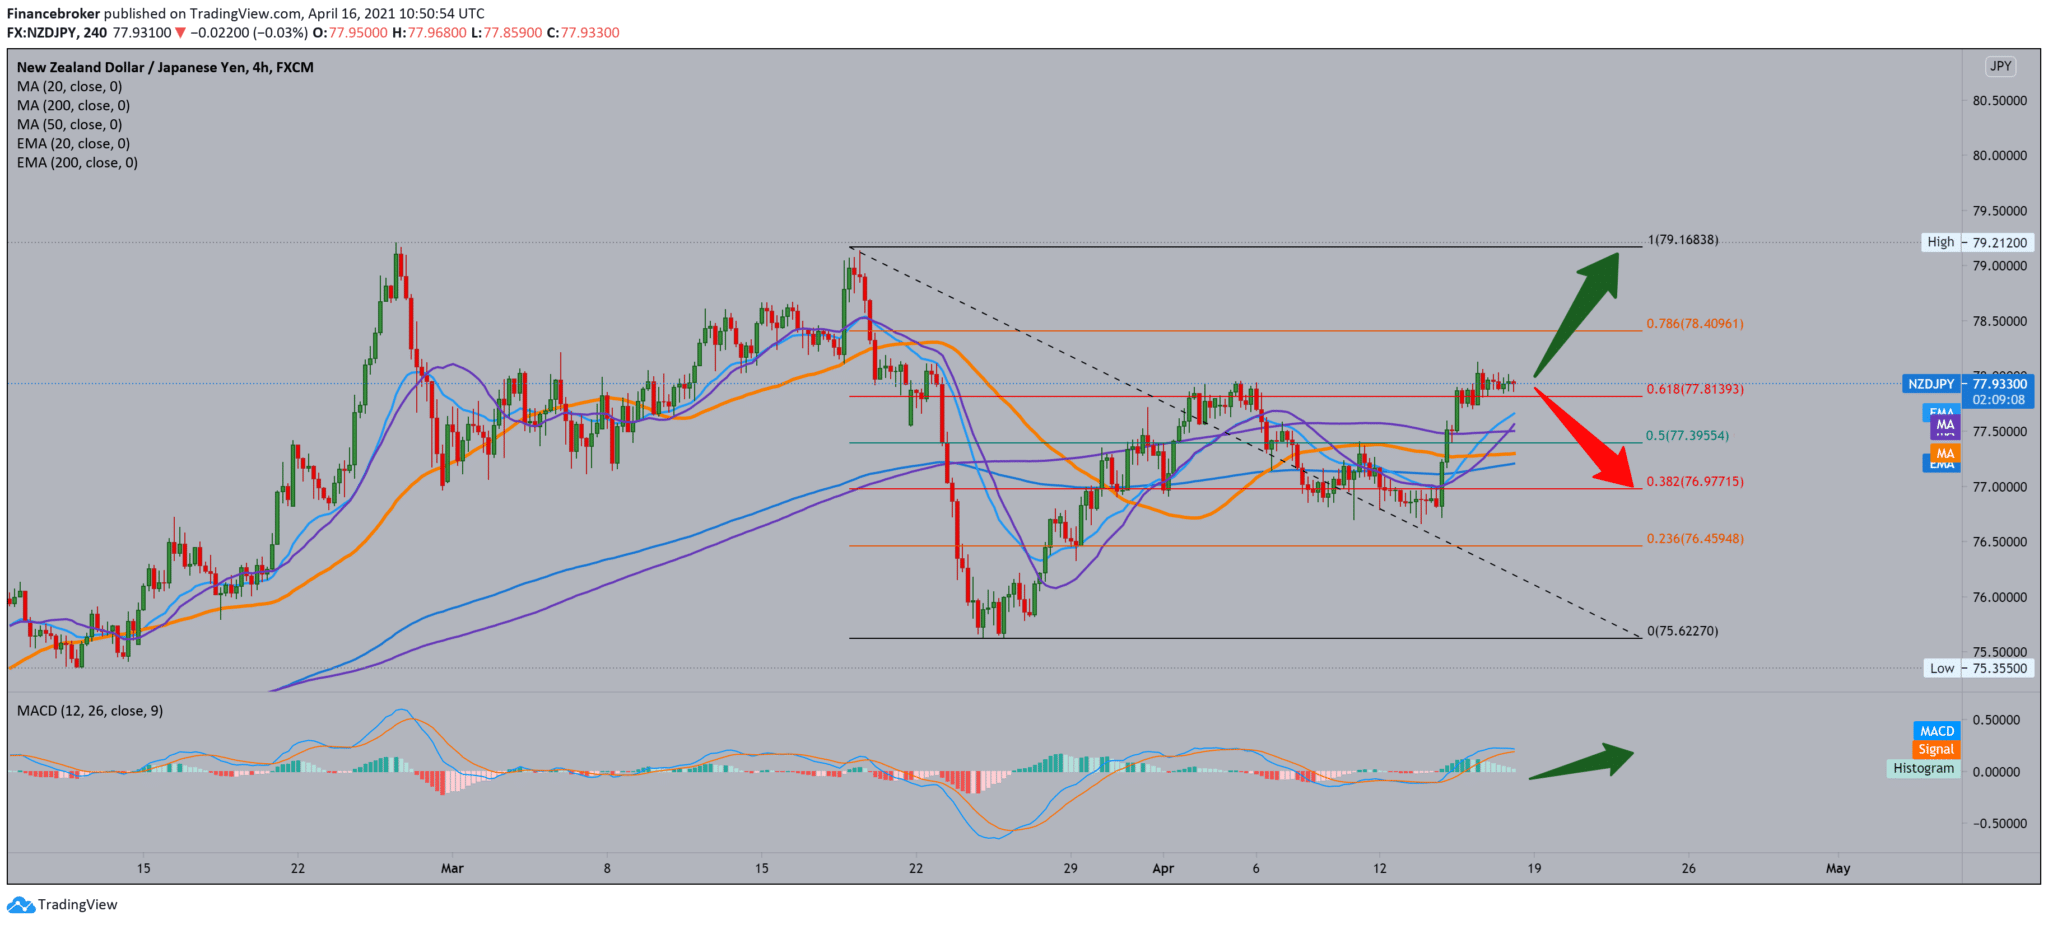
Looking at the chart on the four-hour time frame, we see that after finding support at 77.00, we see that the NZD/JPY pair makes a jump to 78.00, testing Fibonacci’s 61.8% level. For now, consolidation is above 61.8% Fibonacci levels, with the probability of continuing further towards 78.6% at 78.40. Our maximum target is the previous high at 79.21. Moving averages are now all on the bullish side, providing a couple of support, pushing this consolidation towards higher levels on the chart. The MACD indicator is on the bullish side, but we see signs of weakening the bullish trend, so we are now in a smaller consolidation around the Fibonacci level.

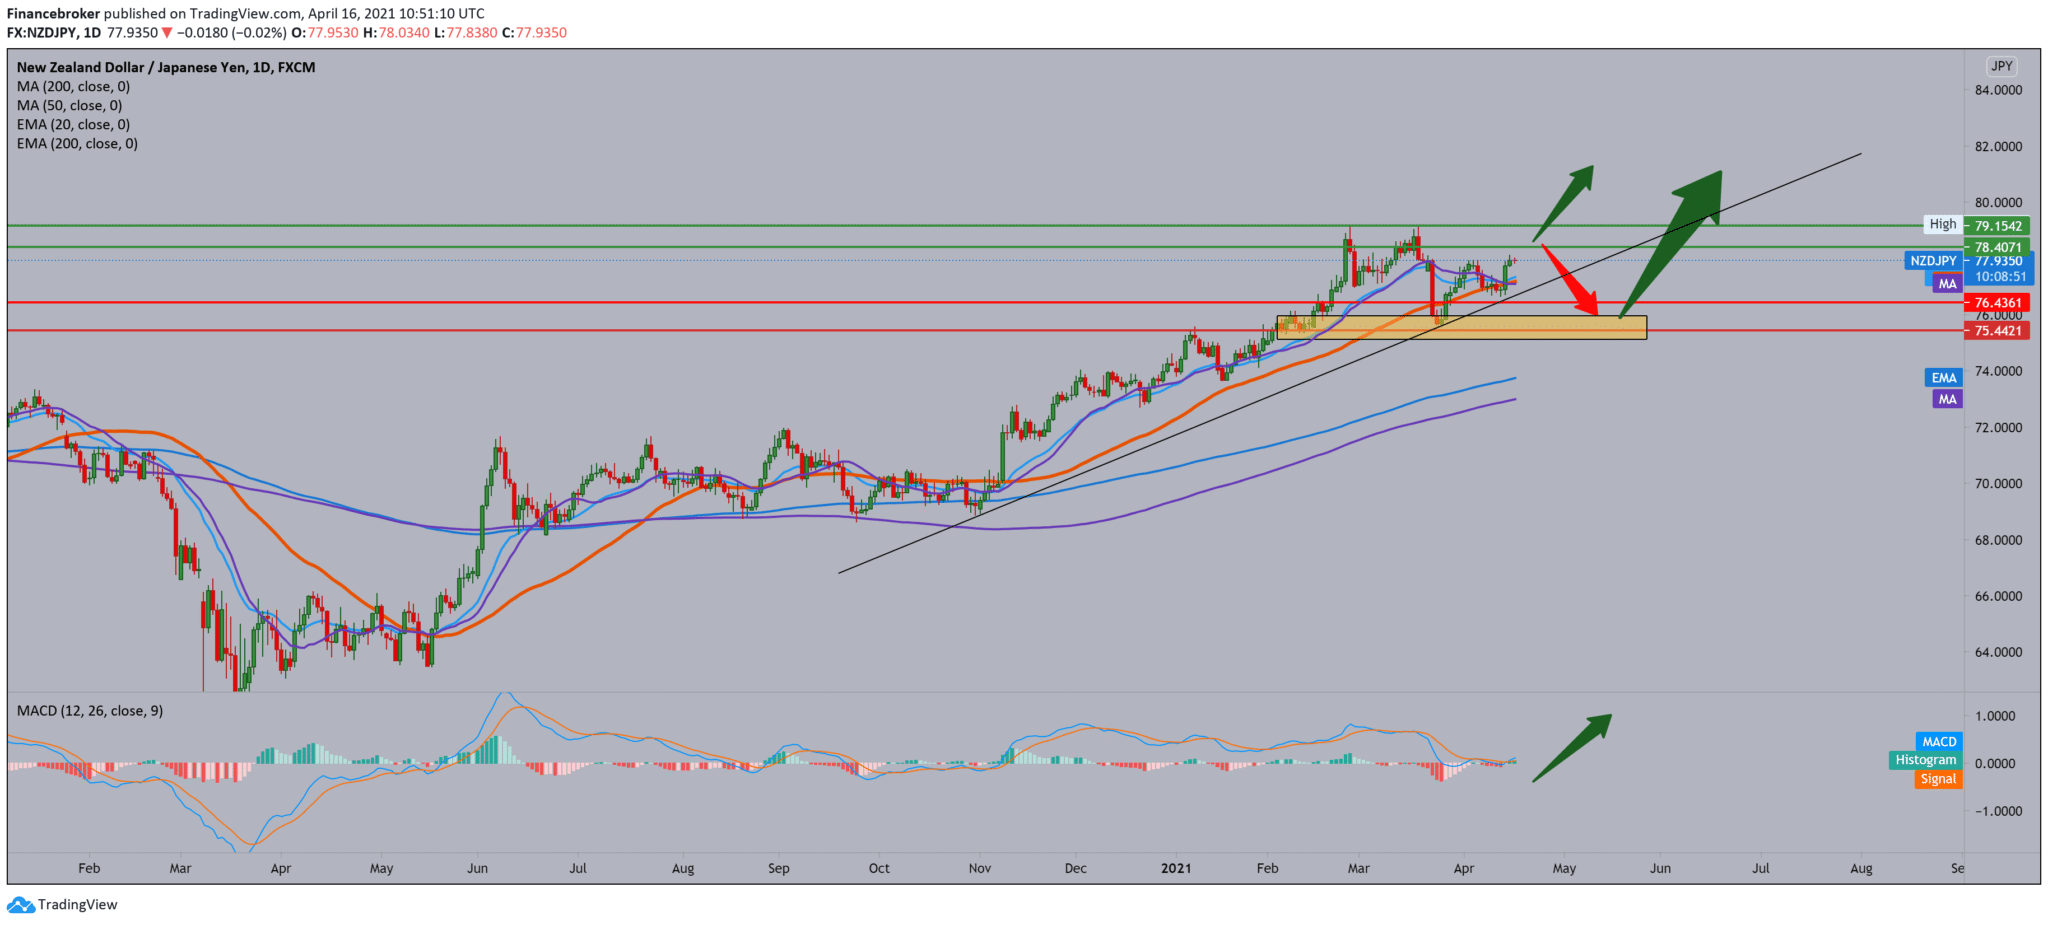
On the daily time frame, we see that the NZD/JPY pair also found support for the bottom line of support and moving averages MA20, EMA20, and MA50. Based on this picture, we could conclude that the couple will continue in the next period until 80.00. And here, we can expect the next resistance to even higher targets on the chart. We need a break below the MA50 and the bottom trend line for the bearish trend to make sure the bearish signal is strong and safe. The MACD indicator gives us a clear bullish signal, where the blue MACD line crossed the signal line, entering the green bullish zone.
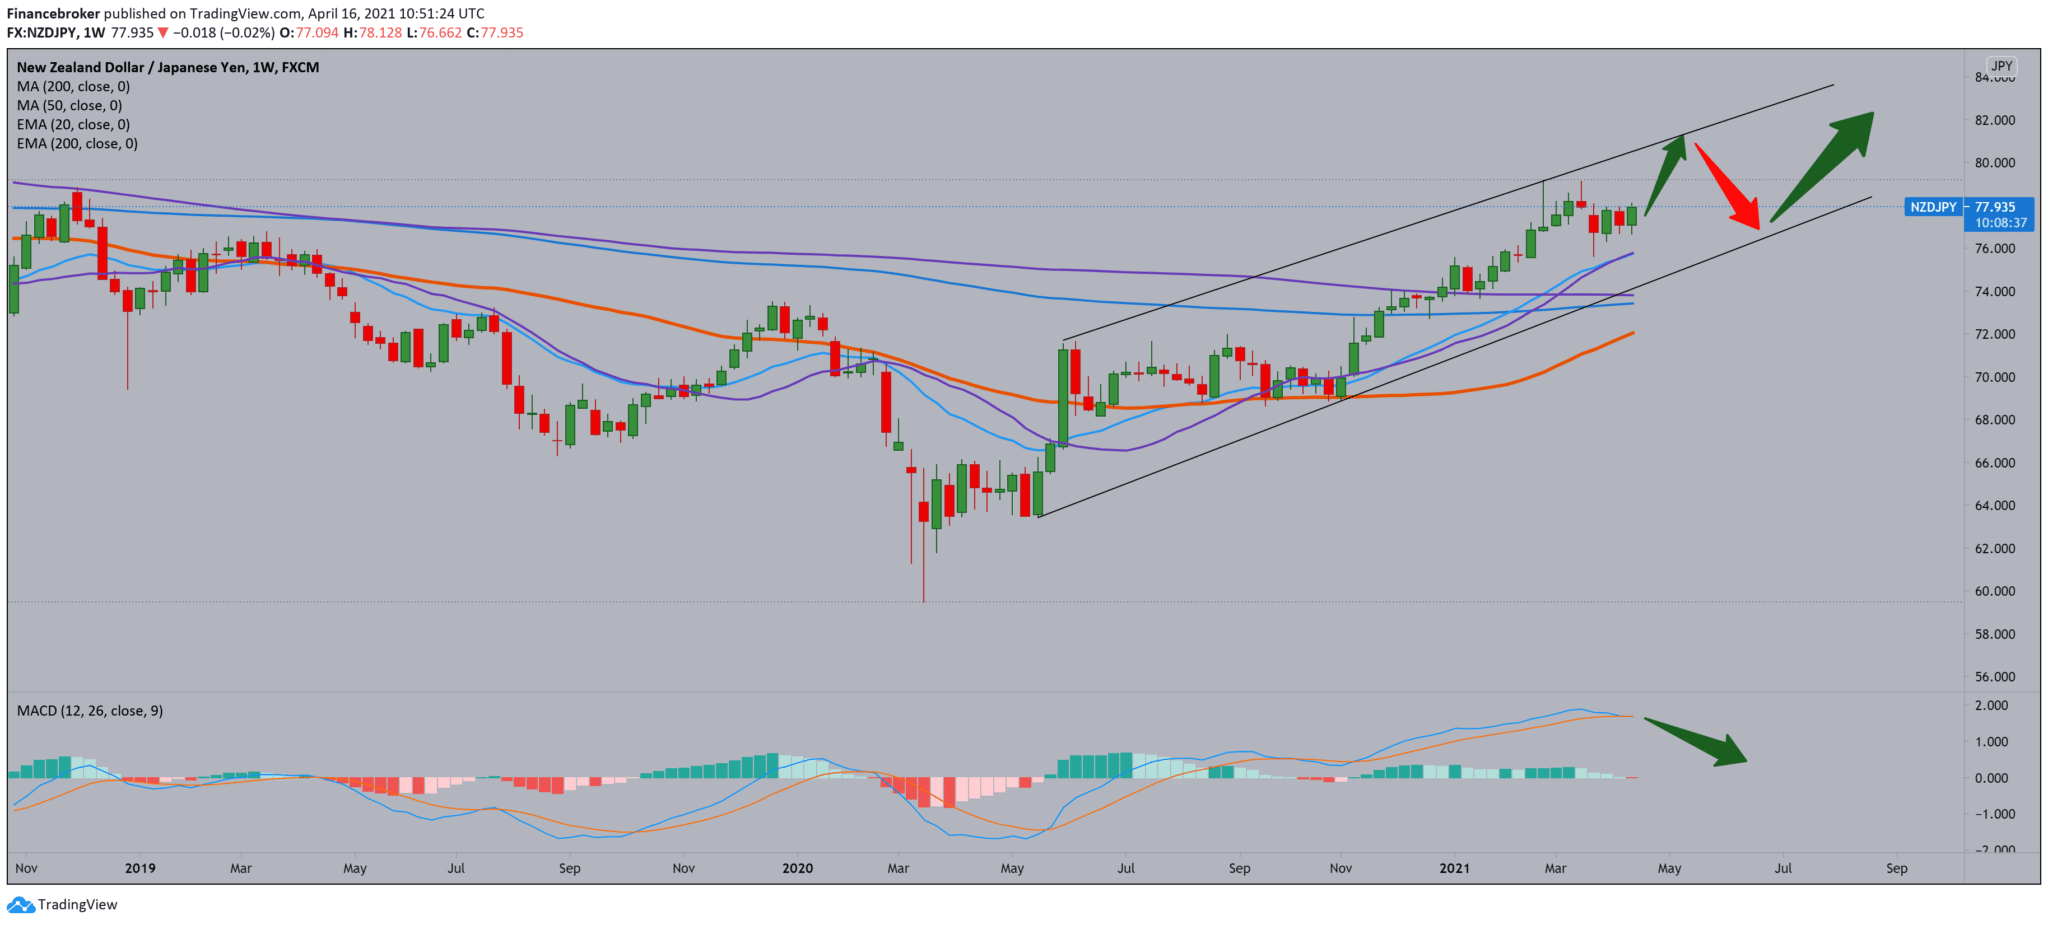
 On the weekly time frame, we are in a large rising channel, with the support of moving averages from below, pushing the NZD/JPY pair towards 80.00, to test that zone. The MACD indicator is a bit vague; based on it, we see a weakening of the bullish trend; for now, the indicator is moving sideways and is not relevant to us at the moment as a trend indicator.

-
Support
-
Platform
-
Spread
-
Trading Instrument


