New Analysis Shows Oil Price at $76.53 and Rising
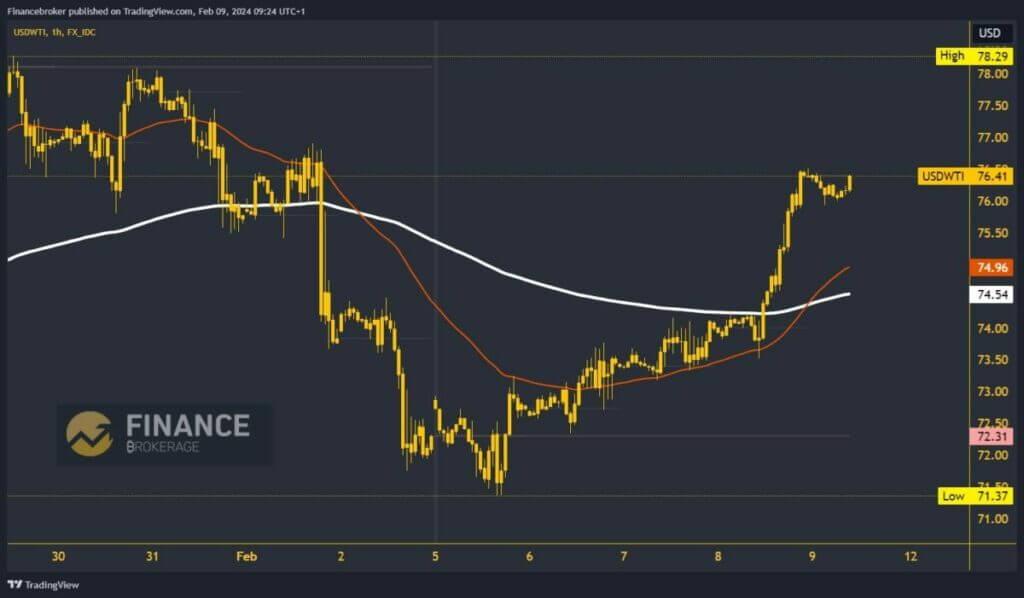
- Since the previous analysis on Wednesday, the oil price has continued to grow, forming a new high last night at the $76.53 level.
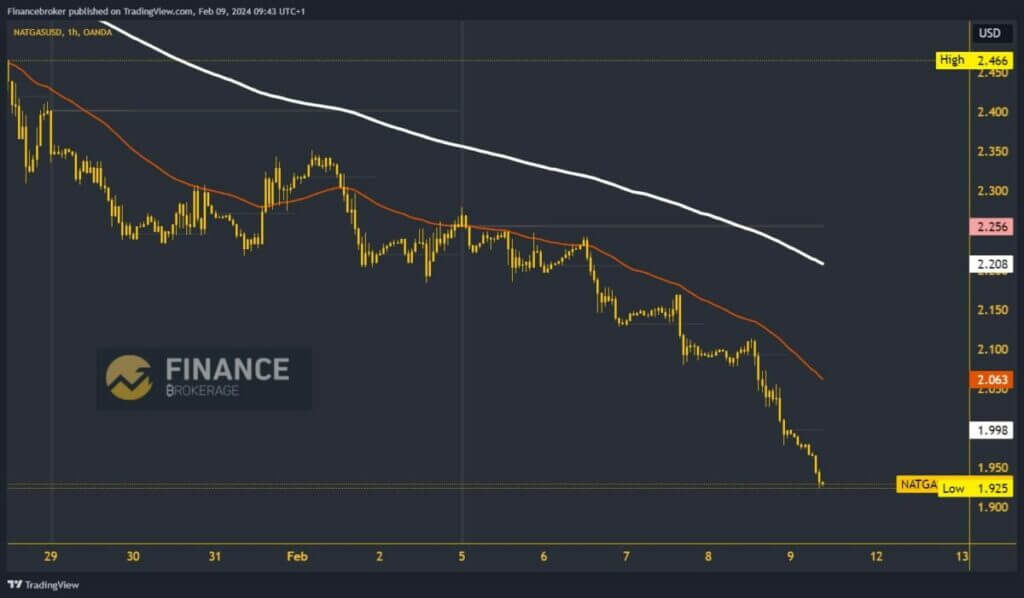
- The price of natural gas falls to a new multi-year low at the $1,925 level.
Oil chart analysis
Since the previous analysis on Wednesday, the oil price has continued to grow, forming a new high last night at the $76.53 level. During the Asian trading session, we saw a slight pullback to support at the $76.00 level. At the beginning of the EU trading session, the oil price made a bullish impulse and moved up to the $76.35 level. Now, we are again on the way to testing the previous high.
The oil price is in strong momentum, and we expect to see a break above and rise to a new weekly high. Potential higher targets are $77.00 and $77.50 levels. For a bearish option, we need a negative consolidation and a drop below the $76.00 level of support. This would first form a new daily low. Price would be under pressure to look for support at a lower level. Potential lower targets are $75.50 and $75.00 levels.

Natural gas chart analysis
The price of natural gas falls to a new multi-year low at the $1,925 level. On Wednesday, we saw an attempt to hold the price above $2.10, but there was a break below and a continuation of the pullback. Yesterday, the decline continued below the $2.00 level, and today we fell below the $1.95 level. There is a high chance that we will continue even lower to the $1.90 level.
We need to go back to the $2.00 level for a bullish option. In this way, the price would move away from the critical bearish zone. We would have a chance to form a bottom at this level. After that, we would go into recovery with bullish consolidation, and the potential higher targets are $2.05 and $2.10 levels. That would be a good prelude to further recovery in the coming week.


