


Inverted Cup and Handle Pattern: Explained
The use of chart patterns in the analysis of financial markets has been a foundational practice in the realm of technical analysis.
Key takeaways
- With the advent of advancements in the fintech sector throughout the 20th century, chart patterns gained even further popularity among market participants as they could now be analyzed and recognized with greater ease and efficiency.
- One such chart pattern that has gained prominence in the world of trading and investment is the inverted cup and handle pattern.
- To make a long story short, the inverted cup and handle pattern is a short-term bearish reversal pattern that appears in an upward price trend.
Understanding the inverted cup and handle pattern
The renowned American technician William J. O’Neil introduced the concept of the cup and handle pattern in his book, “How to Make Money in Stocks.”
The cup and handle pattern manifests in two distinct variations – traditional and inverse forms. A common query often arises regarding the disparities between these two patterns.
The traditional cup and handle pattern serves as a bullish continuation indicator.
What’s important, the inverted cup and handle pattern’s essence aligns with its name and function. In contrast with a traditional cup and handle pattern, an inverted cup and handle is an indication of a bearish movement.
What is the difference between a continuation pattern and a reversal pattern?
The continuation pattern suggests that the ongoing trend, whether bullish or bearish, is likely to continue after a brief pause.
A good example of a continuation pattern includes the bullish rectangle, bearish rectangle, bullish pennant, and bearish pennant.
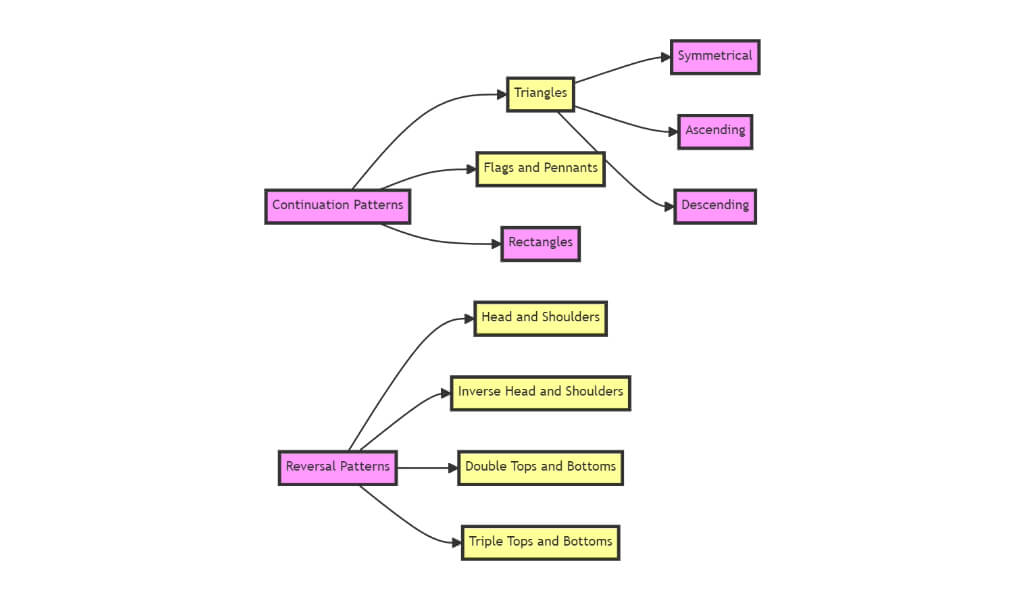
What about a reversal pattern?
It indicates that the market may reverse its direction from the ongoing up or downtrend. Good examples include double tops and double bottoms.
Utilizing the inverted cup and handle pattern
The inverted cup and handle pattern serves as a valuable tool for traders.
The inverted cup and handle pattern strongly signals a selling opportunity for traders. Nevertheless, it’s important to exercise caution and refrain from rushing into a short trade as soon as initial signs of the pattern emerge on the chart.
The highest probability of success typically presents itself after the full formation of the inverse cup and handle pattern has been confirmed.
Here are some strategies and indicators that can complement the inverted cup and handle pattern:
Moving averages
The adage “the trend is your friend” holds significant weight in trading, emphasizing the importance of identifying and following market momentum.
Given that the inverted cup and handle pattern is an example of a trend continuation, it can be effectively combined with trend indicators.
It is worth noting that moving averages, such as MACD and RSI, are some of the few general trend indicators.
Stochastic divergence
The stochastic oscillator is a momentum indicator. It consists of the two moving averages oscillating between 0 and 100. A value above 80 indicates that it is overbought, while a value below 20 indicates oversold conditions.
Stochastic divergence occurs when there is a disparity between the market price and the stochastic oscillator’s readings.
Volumes
Volume was one of the main indicators utilized in institutional trading back in the 70s as well as in the 80s. We need to mention that volume continues to play an important role even after so many years.
What’s important, high or low volume can indicate an increase or decrease in market activity for a certain financial instrument. As a reminder, volume is a lagging indicator and may not always predict price movements correctly.
Interesting facts about financial markets
It is always a good idea to gather more information about financial markets.
Financial markets are dynamic and complex ecosystems where various assets, such as stocks, bonds, currencies, and commodities, are bought and sold. Here are some intriguing details about these markets:
High-speed trading

Financial markets have evolved with the advent of high-frequency trading (HFT) algorithms. These algorithms execute thousands of trades in a fraction of a second, making markets even more efficient but also increasing their complexity.
Cryptocurrency revolution
The rise of cryptocurrencies, led by Bitcoin, has introduced a new and highly volatile asset class to financial markets. Cryptocurrencies are known for their decentralized nature and potential for enormous price swings.
Market sentiment
Market sentiment plays a significant role in price movements. Factors like news, social media trends, and economic indicators can swiftly sway investor sentiment and impact asset prices.
Liquidity pools
Liquidity pools, created by market makers and institutional investors, ensure that there are buyers and sellers for most assets, even in turbulent times.
Market exchanges
Financial markets operate on various exchanges worldwide, such as the New York Stock Exchange (NYSE) and NASDAQ for equities, the Chicago Mercantile Exchange (CME) for futures, and Forex markets for currencies.
Derivatives market: The derivatives market is enormous and includes options and futures contracts. These financial instruments derive their value from underlying assets and are used for hedging and speculative purposes.
Market manipulation: Despite stringent regulations, market manipulation still occurs. Traders may attempt to influence prices through techniques like spoofing, where they place fake orders to deceive other market participants.
Conclusion
The inverted cup and handle pattern is a notable chart pattern in the arsenal of technical traders, particularly in the forex and financial markets. This pattern’s significance lies in its ability to signal potential bearish reversals, offering traders the opportunity to capitalize on downtrends.
However, it is vital to approach the inverted cup and handle pattern with a comprehensive strategy that incorporates additional technical indicators and tools for confirmation. While the pattern provides valuable insights, trading decisions should consider multiple factors, including market conditions, risk management, and broader economic trends.
Moreover, it is crucial for traders to remember that no single chart pattern or indicator is infallible. Market dynamics can change rapidly, and trading psychology can play a significant role in executing successful trades.
As such, traders are encouraged to practice due diligence, continuously refine their strategies, and adapt to evolving market conditions.

