Fibonacci moving averages – practical application for traders
Moving averages represent one of the most common trading tools. They offer useful data regarding trends and resistance, and support zones. You can find a lot of moving average indicators in chart analysis. In this article, we dive deep into Fibonacci moving averages. Also, we will see answers to the following questions: what can you deduce from this indicator? And how can you use the Fibonacci moving average when making your investment choices?
What is the Fibonacci moving average?
The moving average is an indicator frequently used by investors because these averages often provide support or resistance. The Fibonacci Moving Average indicator represents a mix of Fibonacci sequences and Moving Averages. This indicator can be used with other indicators, such as RSI and MACD.
It is particularly interesting to use several Moving averages from different periods to confirm a trend or a break. When three MAs go in the same direction, we have a very strong indicator, which should not be underestimated. Some also use two moving averages of the same duration but calculated from the highs and lows. Delimiting an area allows better visibility.
The Fibonacci sequence is useful for identifying potential zones of the value on the analytic chart. It identifies resistance and support areas on the price chart. Besides, it’s useful to identify reversals and market trends.

Fibonacci sequence in trading
The Fibonacci sequence has been used in the financial markets for more than a century, more particularly the golden ratio.
This golden ratio and its different fractions allow us to determine retracements. These are the famous Fibonacci retracements. These retracements are a technical tool available on all technical analysis platforms. It can be classified as a consolidation indicator inside a directional channel.
As you know, the price of an asset never moves in a straight line. Consolidation phases appear during an uptrend. The market breathes, and the pressure comes down. It’s a healthy reaction.
The opposite is also true in a downtrend. During a price capitulation, even temporarily, a first technical rebound takes shape. Bargain purchases may occur on the title.
2 types of retracement exist:
The downward retracement after a strong bullish move.
The upward retracement after a strong bearish move.
These retracements are based on the idea that the price will retrace a predictable portion of the original trend. Once this retracement has been made, the initial trend will resume its rights.
The key thresholds are 23.6%, 38.2%, 50%, 61.8%, and 78.6%.
The level of 61.8% constitutes the Fibonacci ratio of 0.618, and that of 1.618 is the level of 38.2% (2- 0.382).
The 50% level does not come directly from the Fibonacci sequence but is simply a psychological threshold during a retracement. This indeed corresponds to half of the previous movement.
For many traders, this determines the threshold above which recovery in the direction of the initial trend is possible for the price. If this level is broken, any recovery will be seriously compromised.

The Fibonacci moving average is used alone.
Used alone, the Fibonacci moving average can help to know the market trend. The Fibonacci moving average reduces the “noise” caused by price movements and thus makes it easier to identify the underlying trend.
It also can act as support and/or resistance. Indeed, a moving average can be used, like the support and resistance zones which are usually modeled by horizontal lines, as in the Fibonacci retracement indicator, for example. The fact that the moving average follows the evolution of prices makes it very dynamic, unlike a classic resistance or support zone.
It is, therefore, possible to take positions on the breakout of the moving average by the price. If the price breaks the moving average upwards with the body of a candle, this can be taken as a buy signal. If, on the other hand, the price breaks the moving average downward, this may indicate that it is time to sell.
Another possibility is to take a position in the event of a rebound on the moving average. If the price bounces off the moving average in an uptrend, where the moving average acts as support, the trader may enter a long position. If the price bounces off the moving average in a downtrend, where the moving average acts as resistance, this can be taken as a sell signal.
Combining two Fibonacci moving averages
Fibonacci moving averages can also be used in pairs to detect buy or sell signals.
In this case, we will use 2 moving averages of different periods, and we will seek to identify the points where the shortest moving average crosses the other.
A bullish crossover, or “golden cross,” is a buy signal.
A downward crossover, or “death cross,” is a sell signal.
It is possible to use 2 moving averages of the same type or to combine a simple Moving average (SMA) and an exponential moving average (EMA), for example.
Moving averages are also used in other indicators such as MACD, stochastics, Bollinger bands, etc.
How to implement Fibonacci moving average?

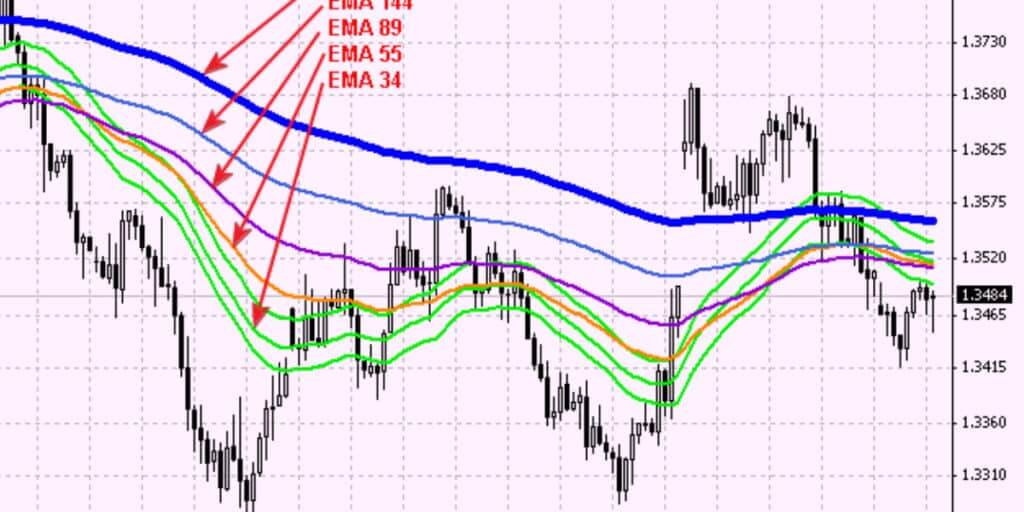
On every trading platform, you can find Fibonacci moving average trading indicators. On some platforms, it’s added as a custom indicator. Once you find it, you need to add it to your analytics chart. If you don’t find it available, you can use an EMA and get a Fibonacci moving average. These are the steps: add an EMA to your analytics chart. Then set EMA’s lock back period to the Fibonacci sequence.
There are many ways you can implement Fibonacci moving averages. Here are some of them. You can use it as a single indicator for trends. Then you can trade pullback reversal from the resistance and support levels. You need to spot the trend direction relying on the slope. There can be upward and downward slopes indicating an uptrend and downtrend. Then you need to wait for the pullback and use a reversal pattern, such as the engulfing pattern, to determine the time of price bouncing off from the indicator line. Besides, you can combine two Fibonacci moving averages and implement a crossover trading strategy.
The Simple Moving Average.
It consists of adding a given number of values and dividing it by this number. A moving average over 10 days will therefore consist of adding the prices of ten sessions (generally the closing prices, but not necessarily) and dividing the result by 10. By calculating this average every day and thus shifting by one session daily, we obtain a curve that makes it possible to erase excessive variations (the noise) to concentrate on the essential: the trend.
The only criticism of this simple moving average lies in its way of looking at a time. All points are equally important. However, any trader knows that the fresher the data, the more influence it has. For this reason, some use exponential moving averages, which give more importance to the most recent data. Most platforms provide moving averages calculation automatically in the settings. However, you have to ask yourself the question of the period you are going to use. A crucial question that also arises for other forms of Moving Averages
The exponential moving averages
An exponential moving average is a time-weighted average. This means that the moving exponential average gives more weight to more recent prices, by applying a certain coefficient to the different closing prices of the courses, depending on their age.
We will not detail the exponential moving average formula here because it is more complex and it is of little interest. The important thing to remember is that compared to the simple Moving average, the exponential moving average places more importance on the latest prices.
Thus, the exponential moving average is more responsive to price changes. This can be seen as an advantage since this responsiveness can allow movement to be detected earlier, but it can also be a disadvantage since, in return for this increased responsiveness, the risk of false signals is greater.
Fibonacci moving averages – Bottom Line

The moving average is an indicator frequently used by investors because these averages often provide support or resistance. The Fibonacci Moving Average indicator represents a mix of Fibonacci sequences and Moving Averages. This indicator can be used with other indicators, such as RSI and MACD.
It is particularly interesting to use several Moving averages from different periods to confirm a trend or a break. When three MAs go in the same direction, we have a very strong indicator, which should not be underestimated. Some also use two moving averages of the same duration but calculated from the highs and lows. Delimiting an area allows better visibility.
You should always perform chart and chart analysis in parallel. If the price draws a pattern of congestion like a triangle, a wedge, or a reversal pattern, do not follow Fibonacci blindly, hoping for a continuation of the correction or the technical rebound.
Also, use other technical indicators like MACD and Bollinger Bands which will inform you about the current price volatility.
Remember to analyze your chart on a higher unit to get a clearer view of the current long-term trend.


