Higher Targets: Oil Price Aiming for $82.00 and $82.50
- The oil price fell to $80.27 yesterday, reaching a new weekly low.
- The price of natural gas retreated to the $1.64 level yesterday.
Oil chart analysis
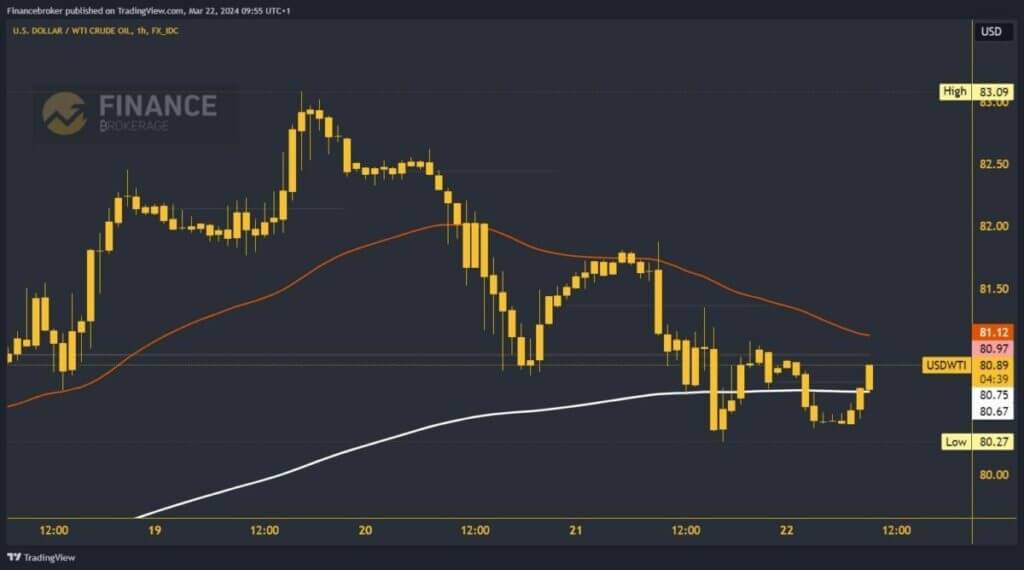
The oil price fell to $80.27 yesterday, reaching a new weekly low. During the Asian session, we once again visited that support zone and are now initiating a bullish consolidation to the $80.90 level. In the zone around $81.00, we are testing the weekly open price, and we need a break above to return to the positive side. We also have EMA200 moving average support, and a jump to $81.50 would also get EMA50 support.
Thus, the price of oil would have better support for the flag on the bullish side. Potential higher targets are $82.00 and $82.50 levels. We need a negative consolidation and a breakout to the $80.00 level for a bearish option. There, we form a new weekly low and get confirmation of bearish momentum. After that, we expect the price to continue sliding, and the potential lower targets are $79.50 and $79.00 levels.

Natural gas chart analysis
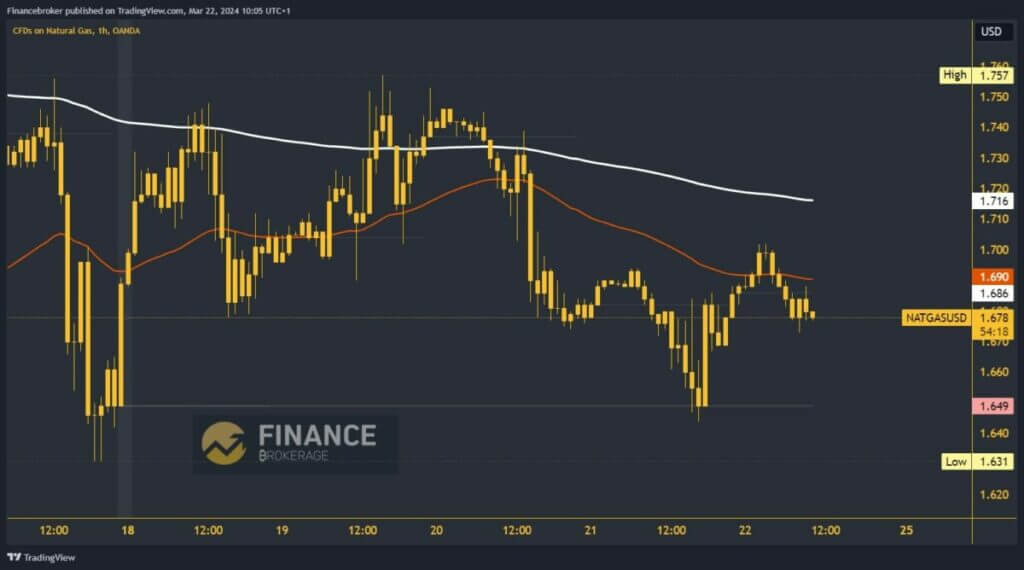
The price of natural gas retreated to the $1.64 level yesterday. We tested the weekly open price in that zone. We successfully held above and initiated a bullish consolidation to the $1.70 level, where we encountered new resistance. This time, we turn to the bearish side and start a pullback. The price is currently at the $1.67 level, and we expect to see a drop below $1.66 in the future.
Potential lower targets are $1.64 and $1.62 levels. If we get support at $1.66, the price of natural gas will form a higher low there compared to the previous one, thereby increasing the chances of initiating bullish consolidation and recovery. Potential higher targets are $1.70 and $1.72 levels. Additional resistance in the zone around $1.72 is the EMA200 moving average.


