Gold and Silver: The price of gold remains above $1980
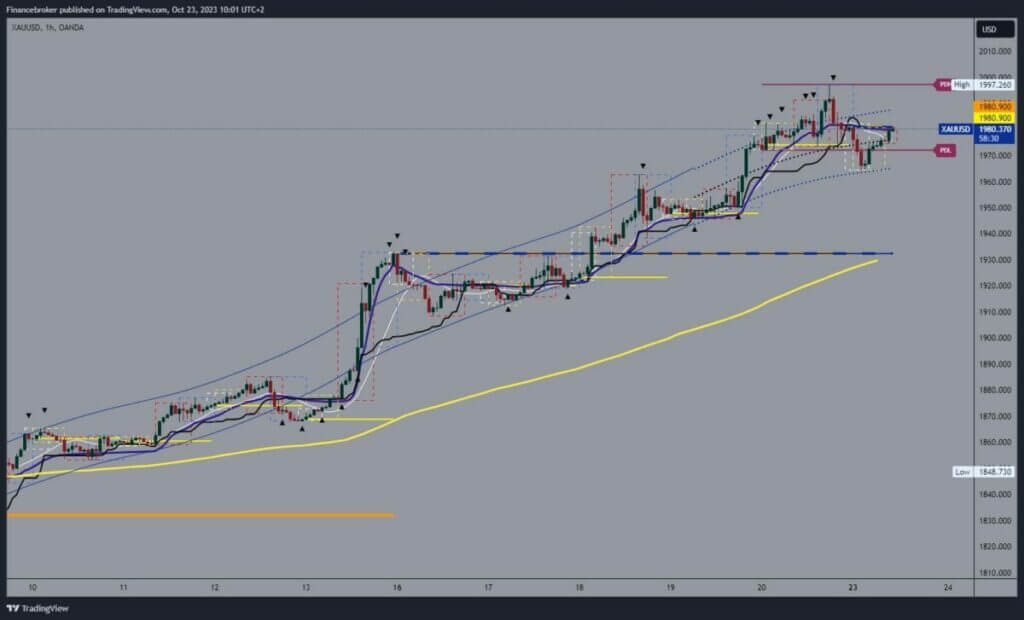
- At the beginning of this week, the price of gold began to pull back to support at the $1965 level.
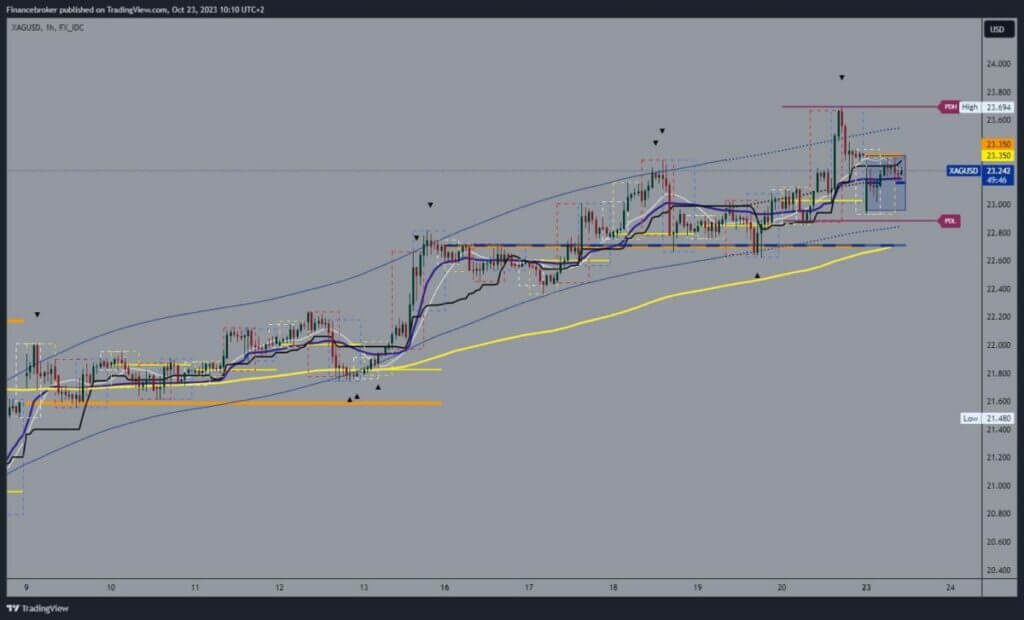
- At the market opening last night, we saw a bearish gap in silver prices up to the $23.00 level.
Gold chart analysis
At the beginning of this week, the price of gold began to pull back to support at the $1965 level. We quickly got support and started a bullish consolidation from that level, and now we are at the $1979 level. We could soon test the opening price at $1980.90. The breakthrough above would tell us that the price of gold has the strength for further recovery, and the target is the $2000 level. Last week’s bullish attempt was stopped at the 1997$ level.
We need a negative consolidation and price pullback to the $1965 support level for a bearish option. A break below would form a new weekly low, which could increase bearish pressure and send us lower. Potential lower targets are $1960 and $1950 levels. EMA50 was in the zone around $1930.

Silver chart analysis
At the market opening last night, we saw a bearish gap in silver prices up to the $23.00 level. We successfully tested that level and initiated a bullish consolidation up to $23.25. We need a break above the $23.35 level to get back above the market’s closing price last week. Potential higher targets are $23.50 and $23.60 levels.
We need a negative consolidation and a new pullback to the $23.00 support level for a bearish option. A pullback below it would bring us down to the $22.80 level, where we would look for support in the EMA50 moving average. A break below this support would also open up space for a deeper pullback in the price of silver. Potential lower targets are $22.60 and $22.40 levels.


