

Candlestick chart patterns: Chapter 2 The Bearish Reversal Pattern
On our previous chapter, we’ve discussed a simple introduction on candlestick patterns. We’ve also talked about the bullish reversal candlestick patterns and how to analyze them. In this preceding chapter, we’ll continue by discussing the Bearish Reversal Pattern.
Continue reading and learn how to deal with bearish reversal patterns. It will be helpful in providing you tools that work best in trading.
Bearish Reversal Patterns
Bearish reversal candlestick indicates that the sellers are in the moment in control of the trade. Similarly to the bullish reversal patterns, it doesn’t mean for you to go short immediately whenever you spot bullish reversal. It will not provide you the edge within the trade.
On the flip side, merge candlestick pattern with other tools to find the high probability trading setup. That is to show further in this post. For now, let us lists down various type of bearish reversal pattern.
The Shooting Star
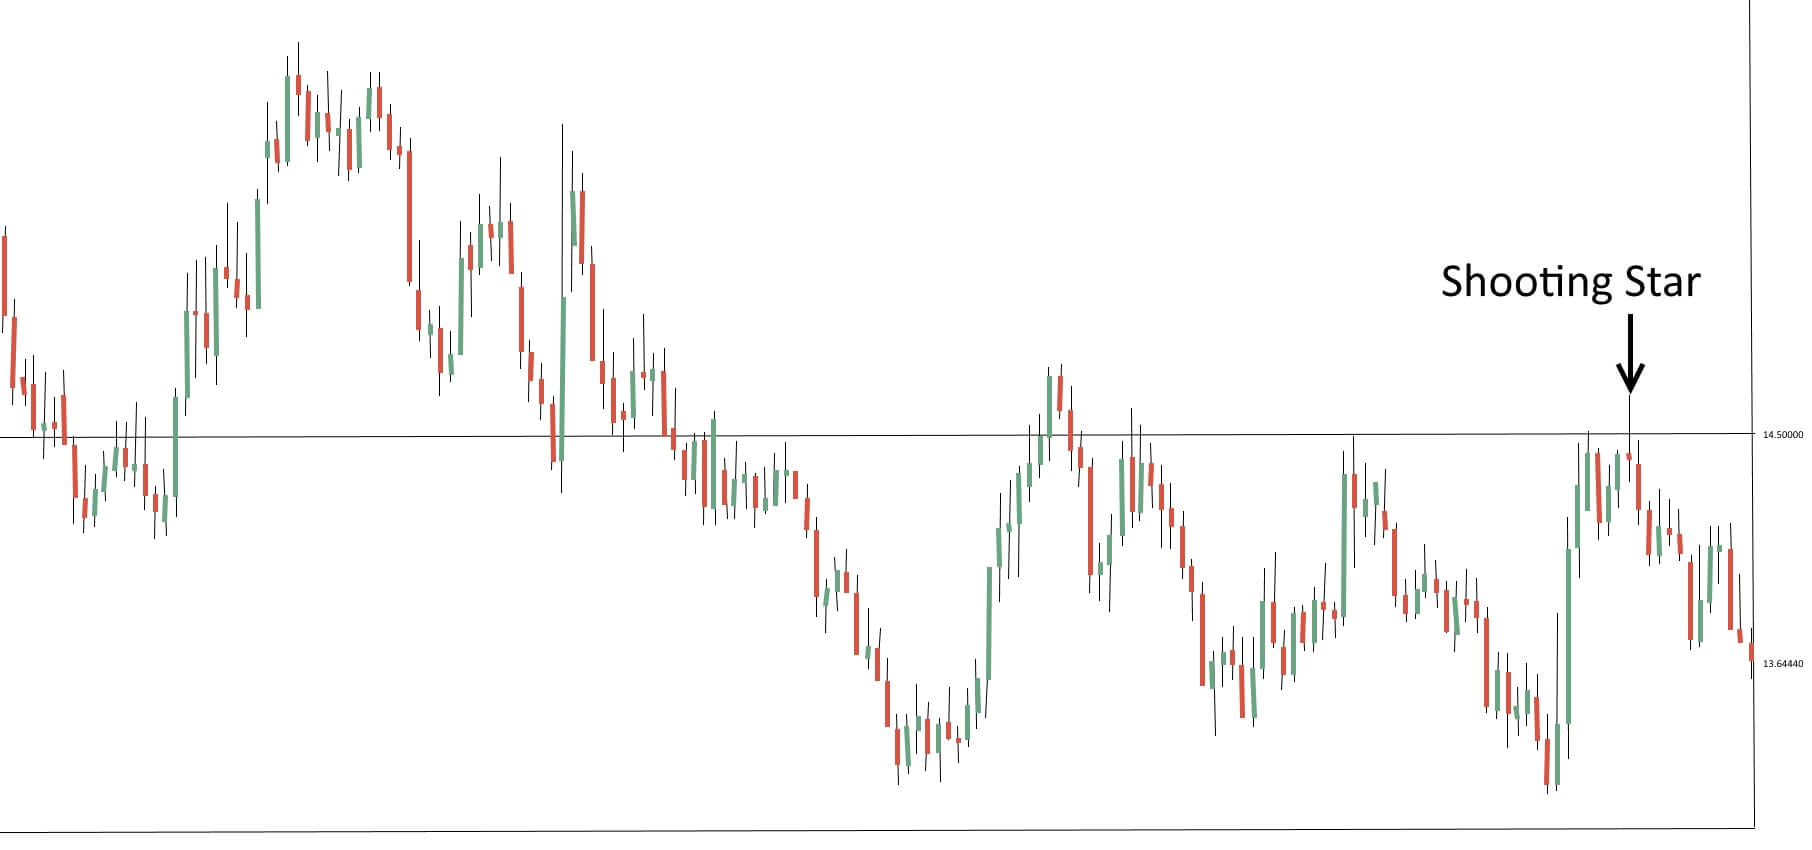
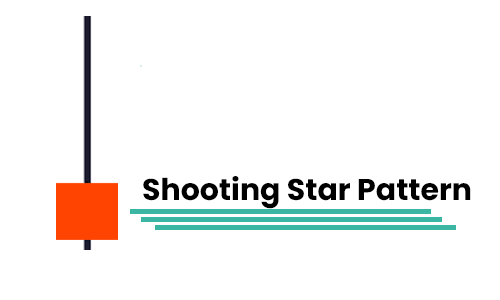 Shooting Start reversal is a one-candle bearish reversal pattern that forms upon incline in price. There’s a way to recognize when a shooting star pattern occurs. One, it is little to no lower shadow. Two, the price close below 1/4 of the range. Three, the upper shadow is at two or three times the length of the body.
A shooting star pattern indicates three things. Firstly, when the trade opens, buyers control it pushing the price higher. Secondly, during a buying climax, a big selling pressure steps in pushing the price lower. Lastly, strong selling pressure is closing below the opening price.
Simply put, a shooting star pattern as a bearish reversal pattern is rejecting the higher prices. Then again, whenever you see a shooting star, it doesn’t mean the trend is to reverse immediately. Look for additional confirmation to increase the possibility of the trade to work out for you.
The Bearish Engulfing Pattern
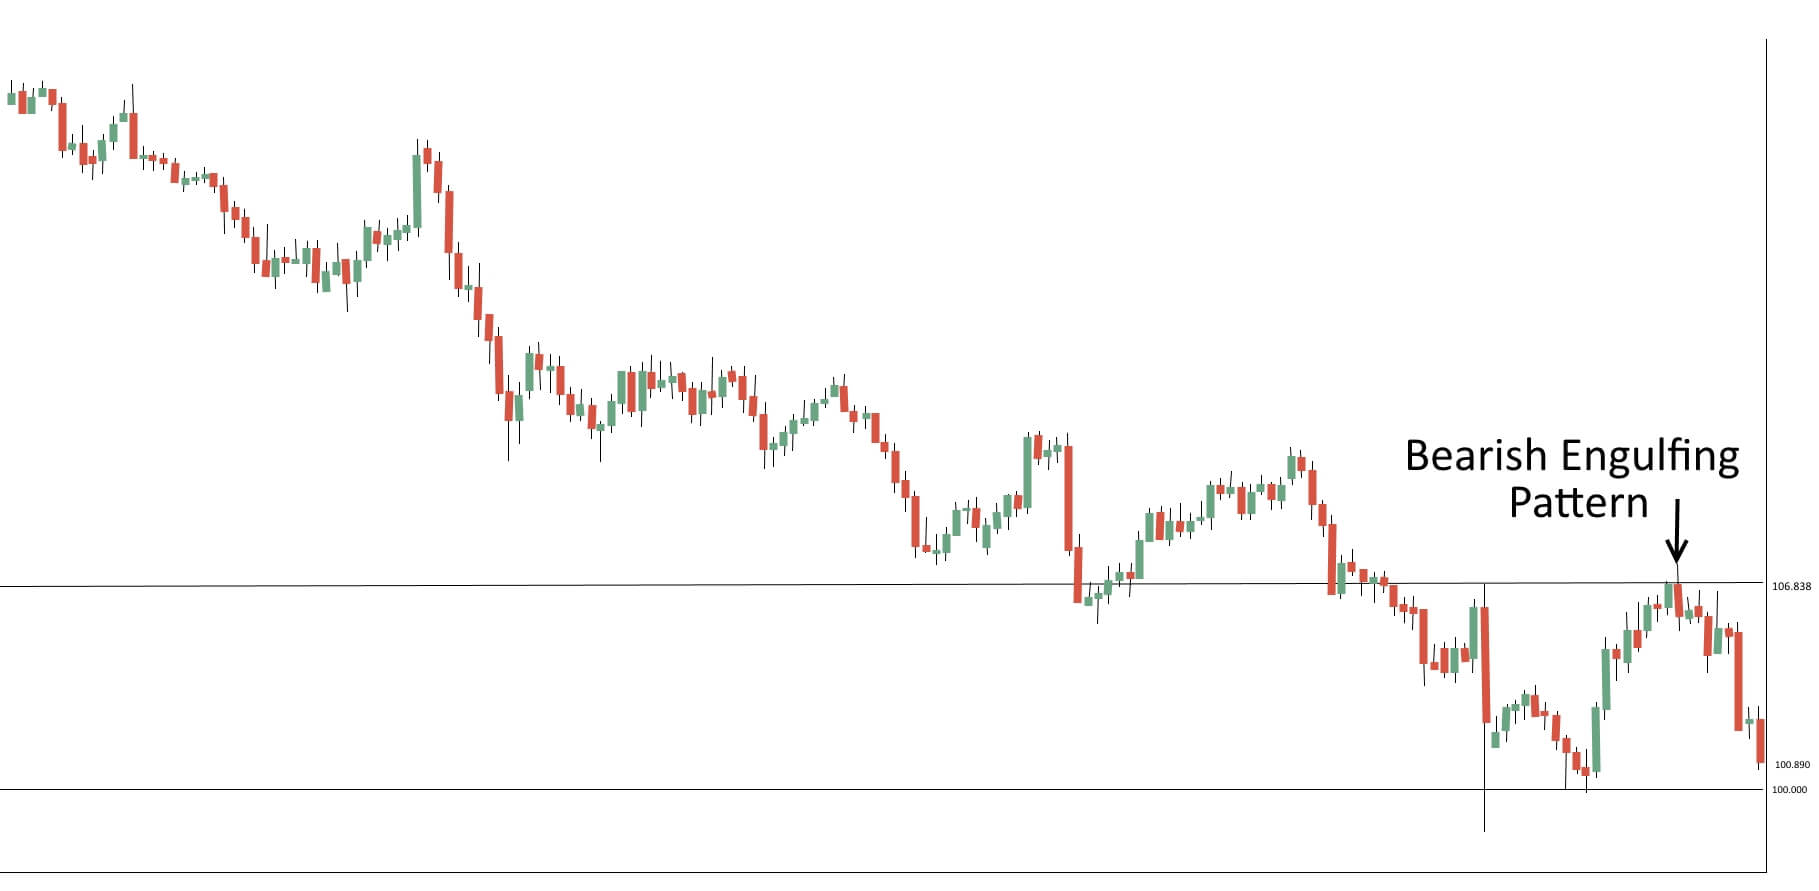
 Bearish engulfing is a two candle bearish reversal pattern that occurs upon an incline in price. There are three ways to identify a bearish engulfing pattern. One, the first candle has a bullish close. Two, the following candle covers the whole part of the first candle. Three, the following candle has a bearish closing.
The bearish engulfing pattern indicates two things. Firstly, looking at the first candle, buyers are controlling the trade as it closes higher for the period. Secondly, the following candle shows strong selling pressure stepping in and closing below the first candle’s low. That means the sellers succeed on the trade for now.
Simply put, a bearish engulfing pattern indicates that the sellers conquered buyers. At that point, they (the buyers) are in control.
The Dark Cloud Cover Pattern
 Dark cloud cover pattern is a two candle bearish reversal pattern occurring upon incline in price. However, dissimilar with the bearish engulfing pattern that closes below the last open, dark cloud cover closes in the body of the prior candle. Meaning when it comes to strength, dark cloud cover is not strong like the bearish engulfing pattern.
There are three ways to identify a dark cloud cover. One, the first candle has a bullish close. Two, the following candle closes halfway behind the mark of the first candle. Three, the following candle has a bearish closing.
The dark cloud cover indicates two things. Firstly, the first candle shows buyers took control upon closing higher for the period. Secondly, the following candle indicates that the selling pressure moves in closing bearishly. That indicates that the selling pressure is nearby.
The Tweezer Top Pattern
 The tweezer top is a two candle reversal pattern occurring upon incline in price. There are two ways to recognize a tweezer top pattern. One, the first candle indicates the refusal of a higher price. Two, the following candle re-try the high of the first candle and closing lower.
A tweezer top indicates two things. Firstly, the first candle indicates that the buyers are pushing the price higher to engage with selling pressure. Secondly, the following candle indicates that the buyers are retrying to push the price higher then failing and finally succeeding by strong selling pressure.
Simply put, the tweezer top pattern indicates that the trade is having difficulty bringing the price higher but is likely to go lower.
The Evening Star Pattern
 The evening star pattern is a three candle reversal pattern that occurs upon incline in price. There are three ways to indicate an evening star pattern. One, the first candle close is bearish. Two, the following candle is at a small range. Three, the last candle aggressively closing lower.
The evening star pattern indicates three things. Firstly, the first candle indicates that the buyers take control of the trade as prices closing higher. Secondly, the following candle indicates the uncertainty within the market. Both buy and sell pressure area are at the equilibrium. Thirdly, the last candle indicates that the sellers succeed and the price is closing lower.
To sum up, the evening star indicates that the buyers are tired and sellers take control at the moment.
Bearish Reversal Setups
To further understand the bearish reversal candlestick patterns (Shooting Star, Bearish Engulfing Pattern, Dark Cloud Cover, Tweezer Top, Evening Star) let’s look at them on a sample market chart.
Here’s how to do it. Firstly, whenever the market is trending lower, wait for a pullback to the resistance. Secondly, upon the pullback to the resistance, wait for the occurrence of a bearish reversal candlestick pattern. Thirdly, upon a bearish reversal candlestick pattern make sure that the size of it is bigger than the previous candle. That is a signal of a strong refusal. Fourthly, upon the signal of strong refusal, go short on the next candle’s opening. Lastly, go vice versa to the long setups. Observe the sample chart below to understand further.
Indecision and Continuation Patterns >>>

