Bitcoin, Ethereum, Dogecoin chart review on 1 December
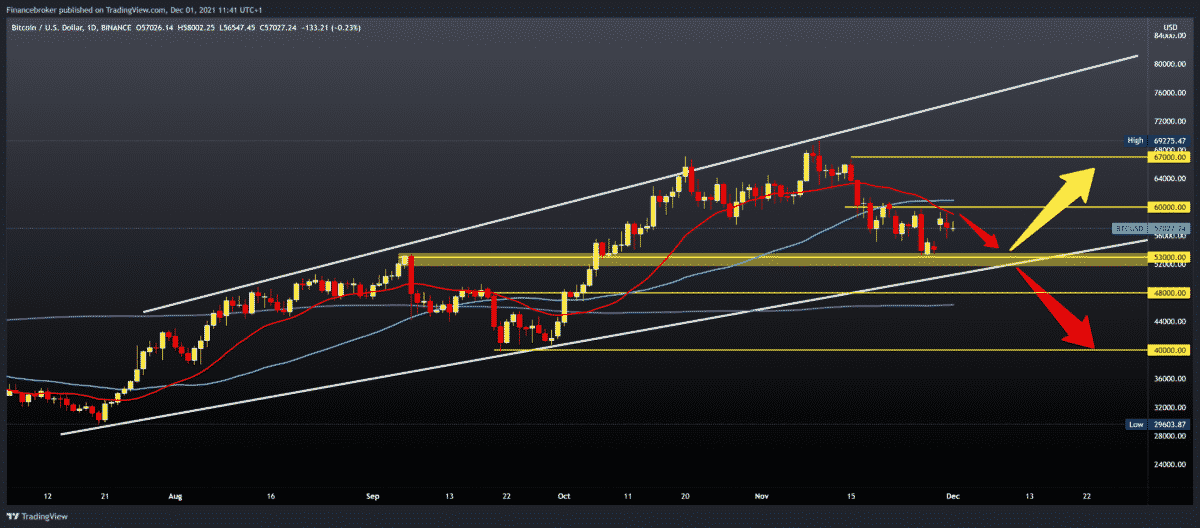
Today we look at the price of Bitcoin on the daily time frame. First, we see that the price has been moving in a rising channel since July. This year’s low was $ 28,695 in June. After that, the price of Bitcoin starts in a bullish trend, creating a current growing channel. In September, the price dropped to $ 40,000, and by forming that higher low, we got a lower trend line. In October, we see that the price started a strong bullish trend, making the first historical high at $ 67,150. Then we have a smaller withdrawal to $ 58,000 in early November and a new bullish boost to a new all-time high at $ 69275. In the second half of November, Bitcoin was in a pullback and made a drop of about 30% to $ 53,250. Bullish scenario:
The price of Bitcoin made a bullish GAP on the chart but stopped in the zone around $ 60,000.
We need a break above $ 60,000 to get support in the MA20 starting average.
After that, our next upper resistance is in the $ 64,000 zone.
Then if the price continues on the bullish side, our next resistance is the previous lower high at $ 67,000.
Bearish scenario:
We need a negative consolidation to close GAP from the beginning of the week and lower the price back to the $ 53000-54000 support zone.
If the price continues, our next support is the lower trend line, around $ 52,000.
A further break below this support will create a new December low, and our potential targets are first a zone at $ 48,000 and then perhaps an area at $ 40,000.
Ethereum chart analysis
Looking at the chart on the daily time frame, we see that the price of Ethereum is very close to jeopardizing the previous high at $ 4868. Significant resistance at $ 4500 has been broken, and the price is now at $ 4723. We have been in a bullish trend since July after the price dropped to $ 1700. In September, the price managed to climb to $ 4,000, making a new high but quickly making a drop on the MA200 moving average at $ 2,650. October is pure bullish, and a growing parallel channel has formed on the chart. We can use it as an approximate price movement in the coming period. In November, we got a new all-time high at $ 4,868, and saturation and euphoria led to a new pullback to $ 4,000. The price found support there, and we have been in this bullish momentum ever since. Bullish scenario:
We need positive consolidation and a break above the zone of the previous historical maximum.
Our first target is the psychological price of $ 5,000.
Bearish scenario:
We need a negative consolidation that would pull the price to $ 4,500 by asking for that support.
Further price reductions could lead us to a larger support zone at $ 4,000.
Additional support is our lower trend line from July.
A break below would increase the bearish pressure on the price and maybe bring us down to much lower levels on the chart.
Dogecoin chart analysis
On the daily time frame, the price of Dogecoin is in a bearish trend. The price of Dogecoin by no means manages to consolidate in the 0.30000-0.35000 zone so that we have a sense of the potential strengthening of the bullish option. We are still below all downward-moving averages. In July, the minimum was at 0.15990, and now we have not moved much because we are currently at 0.21230. Bullish scenario:
We need better positive consolidation, at least above the MA20 moving average.
If the price does this on the chart, the bullish momentum will increase to 0.25000 and the next resistance in the MA50 moving average.
In the zone around 0.27000, we encounter the next resistance in the MA200 moving average.
If the price in 2022 starts above 0.30000, we can expect a continuation of the bullish trend and maybe a new historical high.
Bearish scenario:
We need a continuation of this negative consolidation that started on Monday.
We then descend to a larger zone at 0.20000, which has been our support since August.
A further drop in the price of Dogecoin brings us down to the next low of around 0.160000.