Bitcoin and Ethereum: Bearish pressure is still very present
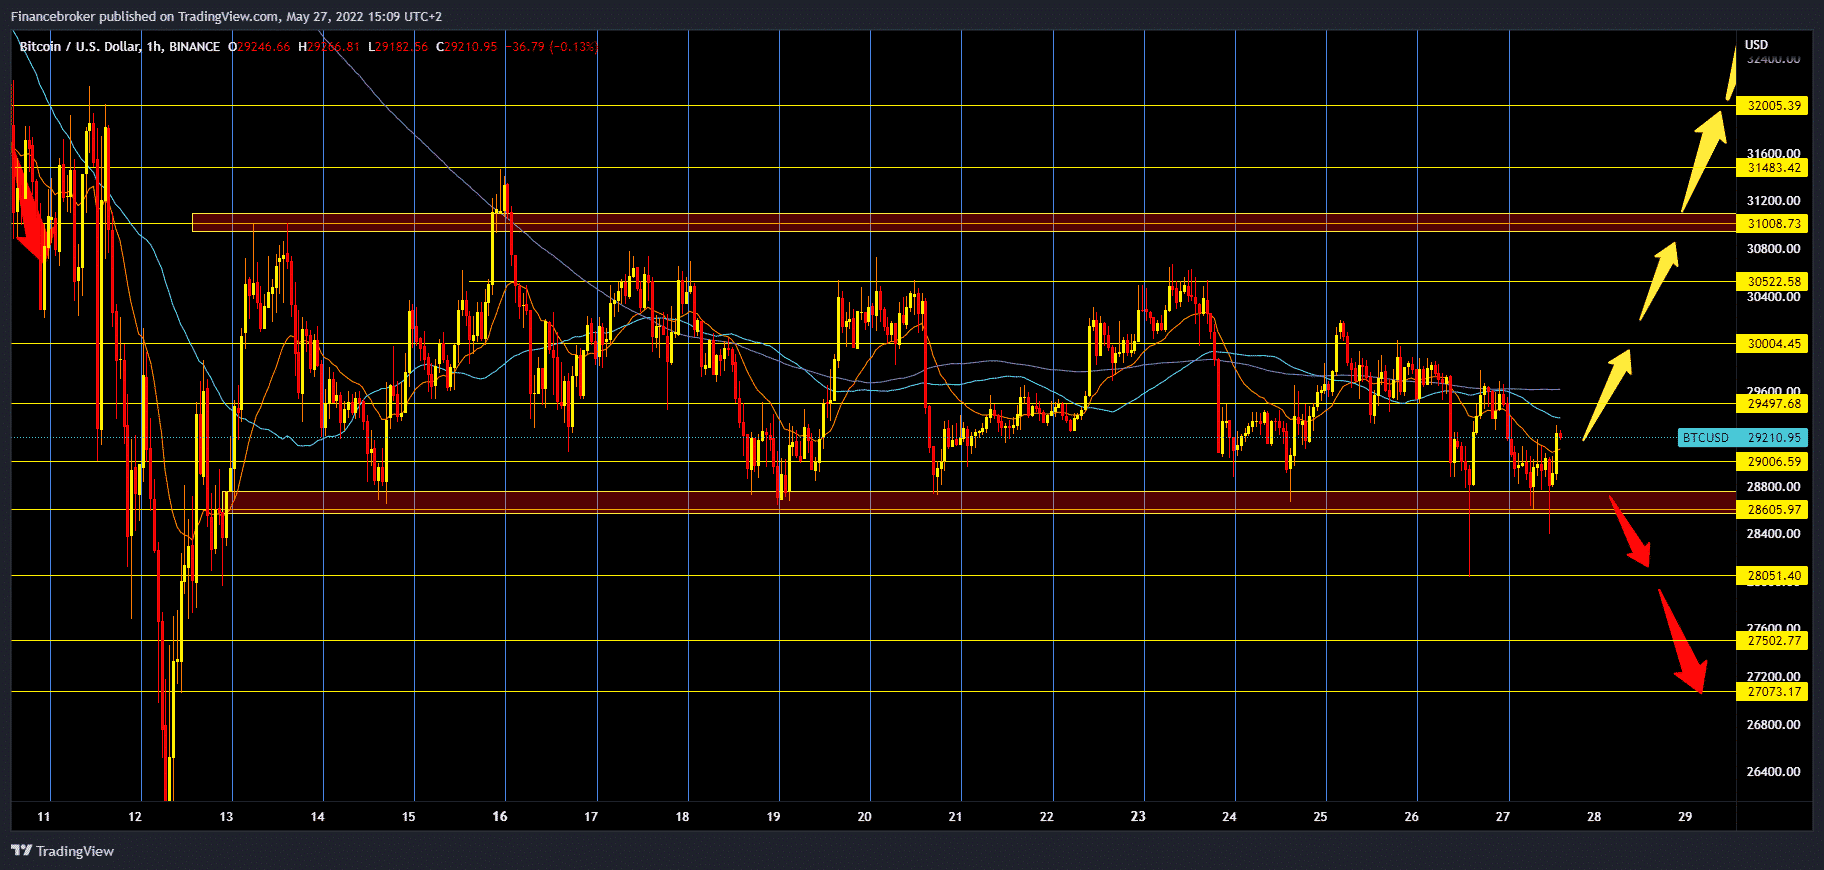
- The price of Bitcoin seems to have no power to break away from the support zone of around $ 29,000.
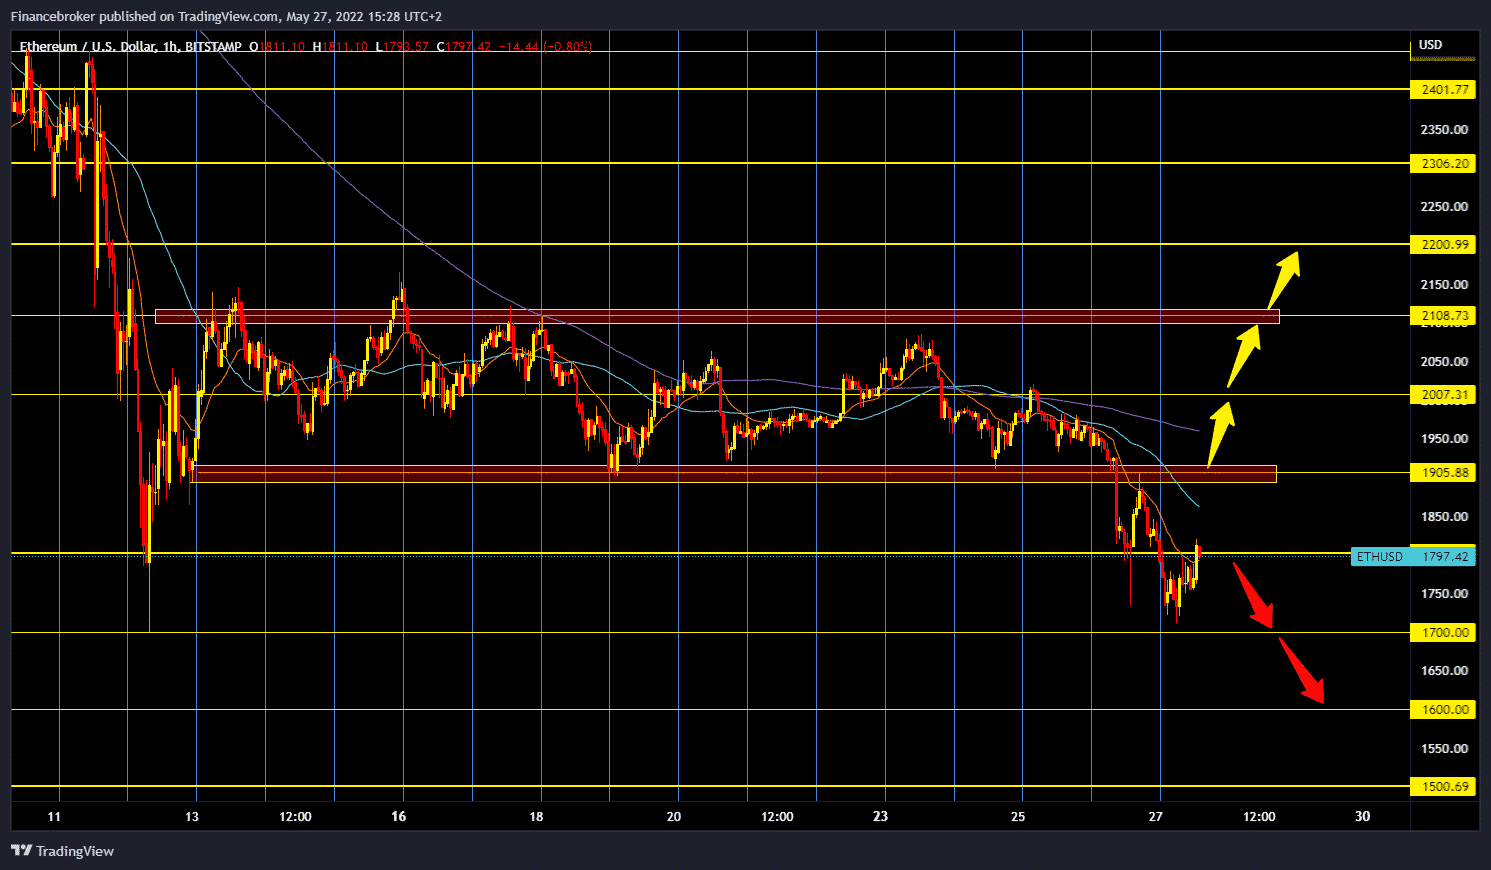
- The price of Ethereum fell to $ 1,712 during the first part of the day, testing the previous low of May 12.
Bitcoin chart analysis
The price of Bitcoin seems to have no power to break away from the support zone of around $ 29,000. Now bitcoin is consolidating in that area, and there could be a smaller bullish impulse that would push us towards the $ 30,000 price. If bitcoin succeeds, then we would need consolidation in the $ 30,000 zone to potentially continue to the $ 31,000 resistance zone. By jumping above $ 31,000, bitcoin could at least partially get rid of bearish pressure. Potential targets above are $ 31,500, $ 32,000 and so on.
In support of this bearish narrative seen in the price of bitcoin is the decline in the number of new addresses that have joined the BTC blockchain over the past year. This metric’s seven-day simple moving average fell from 620,122 to 381,857 between January 9 and May 26.
This decline of 38% of new active addresses joining the Bitcoin network suggests a net decline in investor sentiment around BTC. Also, it indicates that market participants are not interested in BTC at current price levels.
The number of BTCs listed on stock exchanges has risen from 1.89 million to 1.94 million since May 2. This 2.6% increase in supply in centralized entities poses a threat on the sales side.
In the event of a quick breakdown, these owners could panic and sell more pressure and worsen the declining trend. Therefore, this metric on the chain suggests that the chances of a bearish trend are increasing.
Ethereum chart analysis
The price of Ethereum fell to $ 1,712 during the first part of the day, testing the previous low of May 12. After that, we consolidated around $ 1750, and the price has now moved to the $ 1800 level. Bearish pressure is still very present, and we will not be able to breathe until we return to the $ 1900-2100 zone. If Ethereum forms $ 1800 on the lower high chart, it is a sign that we are continuing the bearish trend. Potential bearish targets are $ 1,600, then $ 1,500 levels.