


18 April chart overview for EURUSD, GBPUSD and NZDUSD
- Pair EURUSD continues to slide towards last week’s low at 1.07600.
- During the Asian session, GBPUSD made a break below the previous support zone at the 1.30500 level.
- Last Wednesday, the NZDUSD made a break below the support line that had been formed since the beginning of February.
- The Governor of the Bank of Japan (BOJ), Haruhiko Kuroda, expressed his opinion on the recent depressive move of the yen and its implications for the economy and the monetary policy outlook of the central bank.
EURUSD chart analysis
Pair EURUSD continues to slide towards last week’s low at 1.07600. Today is Easter Monday, and the US market is closed as in European countries such as the UK, Germany, Spain and France. April is very bearish for now, and there are no signs of a potential change in the trend and recovery of the euro. The chances are high that we see testing at 1,07500 levels, then a potential break below and continuing towards 1.07000 levels. For the bullish option, we need a new positive consolidation and a return above 1.08000. After that, we get the first support in the MA20 moving average. Our next target is resistance at the 1.08400 level, while at 1.08600, we find the MA200 moving average. The euro must jump to the 1.09000 level, the upper April trend line. If he manages to cross above this resistance line, then we could say that the euro is slowly recovering.

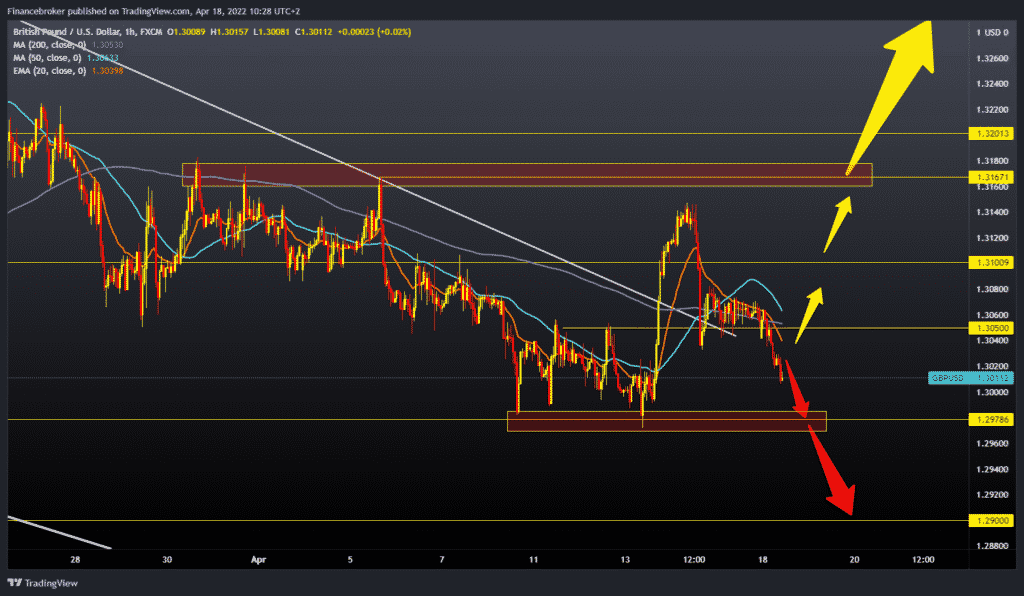
GBPUSD chart analysis
During the Asian session, GBPUSD made a break below the previous support zone at the 1.30500 level. We are now in free fall towards the 1.30000 psychological zone of support. If we stay down too long, maybe we could see a break below and the formation of a new April low. Our next psychological support can be at the 1.29000 level. For the bullish option, we need a return above 1.30500 levels in order to gain additional support in moving averages. Our next bullish target is 1.31000 zones, and with the continuation of the bullish impulse, we may be testing last week’s high at the 1.31400 level. Our larger resistance zone is in zone 1.31600-1.31800, the April maximum. The GBPUSD break above would move us out of the critical zone and perhaps trigger a further recovery of the pound.

NZDUSD chart analysis
Last Wednesday, the NZDUSD made a break below the support line that had been formed since the beginning of February. On Thursday, we had a retest on the trend line, and after that, we have a continuation of bearish trends due to the strengthening of the dollar. Today’s minimum was recorded at 0.67220 level. The current position coincides with the support from March 15, after which we had a bullish impulse. By setting Fibonacci on the chart, we see that the NZDUSD pair stopped at the 61.8% level and that we can now expect some consolidation here or a slight recovery towards the 50.0% level. We need negative consolidation and a drop below 61.8% Fibonacci levels for the bearish option. We are looking for the next potential support in the zone around 78.6% of the level at 0.66380. If it does not last, we will see a drop on the February minimum to the 0.65300 level. For the bullish option, we need a recovery first above the 50.0% level at 0.67820. We get additional support in MA20 and MA50 moving averages. Further bullish consolidation directs us towards the 38.2% level at 0.68400. If we could do that, we would go back above the trend line and continue the previous bullish trend.

Market overview
The Governor of BOJ Kuroda on the movement of the YEN
The Governor of the Bank of Japan (BOJ), Haruhiko Kuroda, expressed his opinion on the recent depressive move of the yen and its implications for the economy and the monetary policy outlook of the central bank. Sudden movements of the yen could harm the Japanese economy, but the governor thinks that even such a weak yen is good for economic growth. Japanese prices are rising due to the increased price of oil and gas, and thus inflation is rising, which is currently within the planned limits. This economic picture only supports the continuation of a light monetary policy and that it is still too early to get out of the stimulus policy.

