USDCHF Moves to New Highs at 0.87622 – Where to Next?
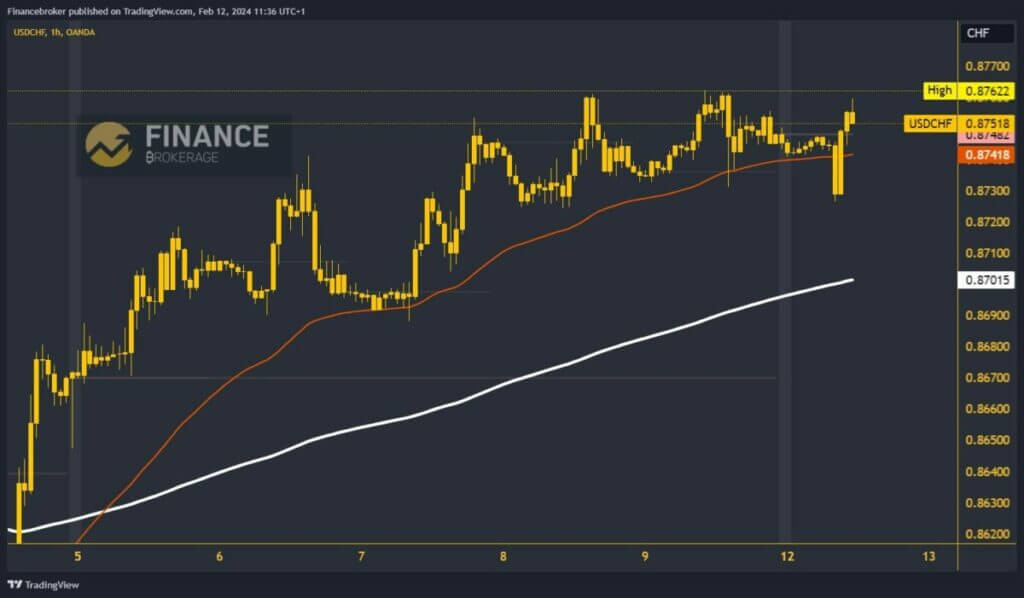
- On Friday, we saw growth and the formation of a new high for USDCHF at the 0.87622 level.
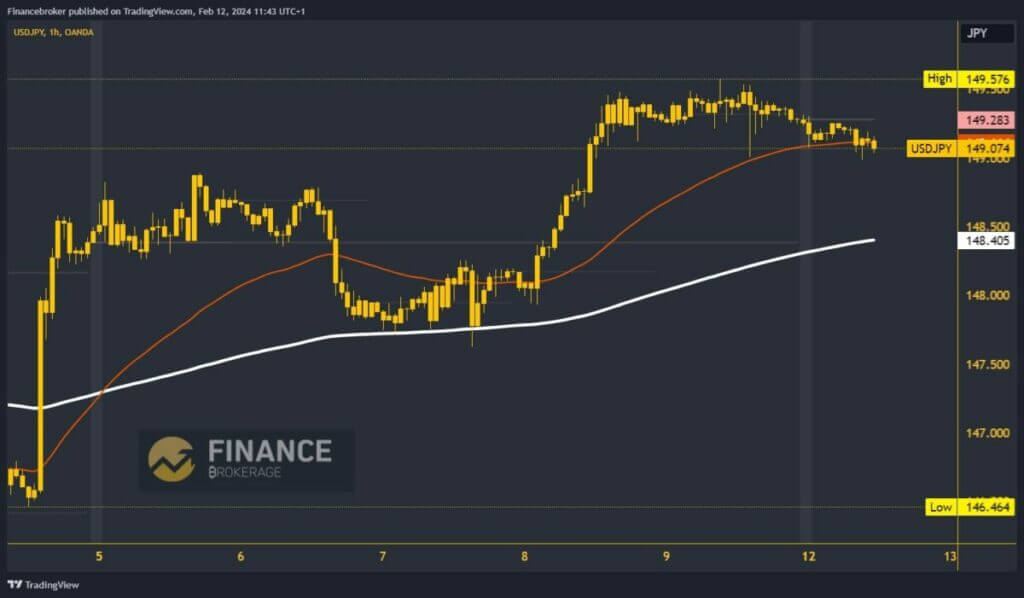
- On Friday, we saw a jump in USDJPY to the 149.57 level.
USDCHF chart analysis
On Friday, we saw growth and the formation of a new high for USDCHF at the 0.87622 level. During the previous Asian trading session, the pair was retreating to the 0.87250 level. There, we find new support and return above the 0.87500 level.
Now, we need to stay up here in order to form the bottom from which to start further recovery. Potential higher targets are 0.87700 and 0.87800 levels.
We need a negative consolidation and a pullback of USDCHF below the 0.87400 level for a bearish option. With that move, we would turn towards this morning’s low, and we could expect a new testing of that support level. Potential lower targets are 0.87200 and 0.87100 levels. EMA200 moving average is in the zone around 0.87000 levels.

USDJPY chart analysis
On Friday, we saw a jump in USDJPY to the 149.57 level. There, we formed a weekly high and started to pull back from that level. During the previous Asian trading session, the pair slipped below the 149.250 level, and we are now testing the 149.00 support level. The dollar remains under pressure as the yen slowly recovers. Potential lower targets are 148.75 and 148.50 levels.
Additional support for USDJPY is in the EMA200 moving average at the 148.50 level. For a bullish option, we need to climb above the 149.30 level. Thus, they would move above the Asian movement zone. Piar could form a new bottom there and start further growth and recovery from there. Potential higher targets are 149.50 and 149.75 levels.


