USDCHF and USDJPY: USDJPY was above 150.00 on Tuesday
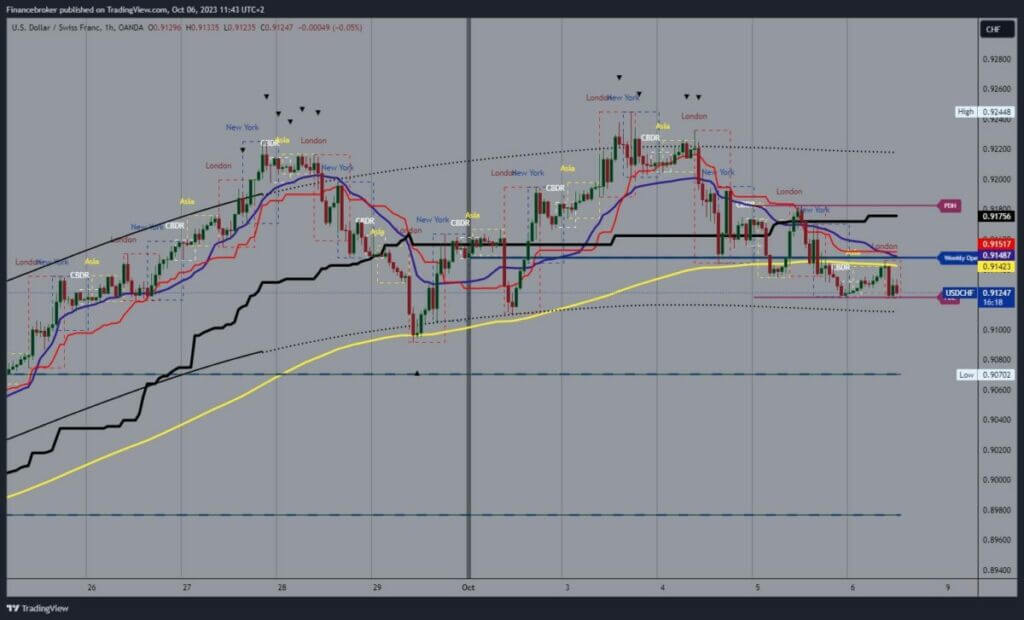
- On Tuesday, we saw the formation of a new six-month high at the 0.92448 level.
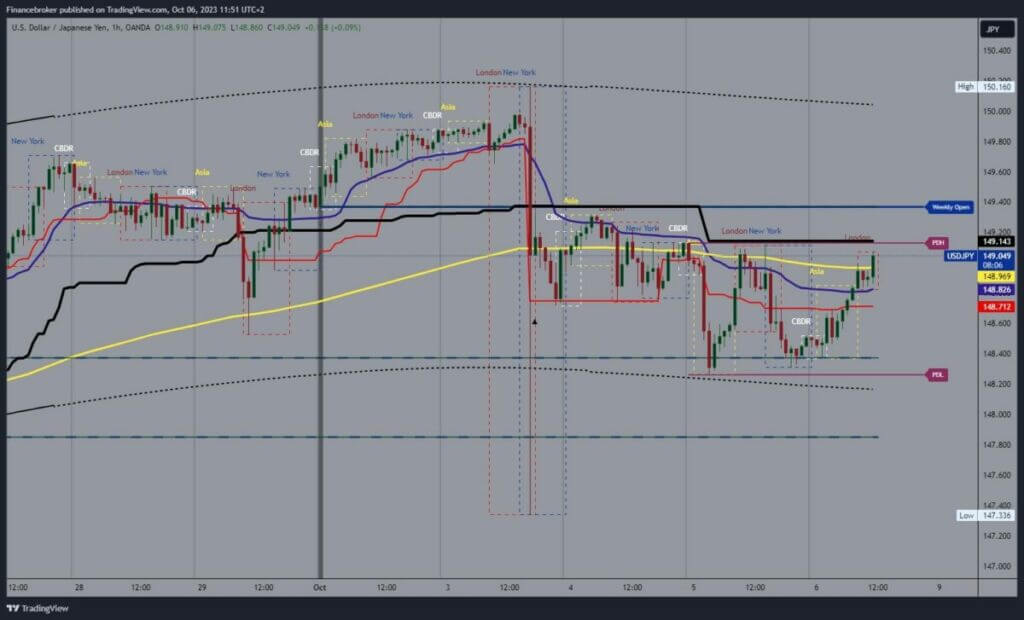
- On Tuesday, USDJPY made a new peak at the 150.16 level.
USDCHF chart analysis
On Tuesday, we saw the formation of a new six-month high at the 0.92448 level. After that, the pair begins to retreat and falls to the 0.91230 level of support last night. During the Asian session, we tried to start a recovery, but we stopped at the 0.91470 level. From there, we start a new pullback and now test the previous support level. Potential lower targets are 0.91000 and 0.90800 levels.
For a bullish option, we need a positive consolidation and breakout of USDCHF above the 0.91500 level. Then we need to hold above there in order to continue the recovery to the bullish side from there. Potential higher targets are 0.91800 and 0.92000 levels.

USDJPY chart analysis
On Tuesday, USDJPY made a new peak at the 150.16 level. In the next few hours, the Bank of Japan intervened, and the pair dropped to 147.33 levels. The intervention was partially successful, and USDJPY rose to the 149.00 level. Since then, we have been in a mild bearish consolidation to the 148.20 level, where we found new support and started a bullish consolidation during the previous Asian trading session.
We are now back at the 149.00 level and expect the pair to continue upwards. Potential higher targets at 149.20 and 149.40 levels. We need a new negative consolidation and a pullback to support the bearish option at the 148.20 level. A break below would confirm the bearish scenario and the formation of a new low. Potential lower targets are 148.00 and 147.80 levels.


