USDCHF and USDJPY: USDJPY manages to climb above 145.00
- This week has been very positive for USDCHF.
- USDJPY managed to recover significantly this week.
USDCHF chart analysis
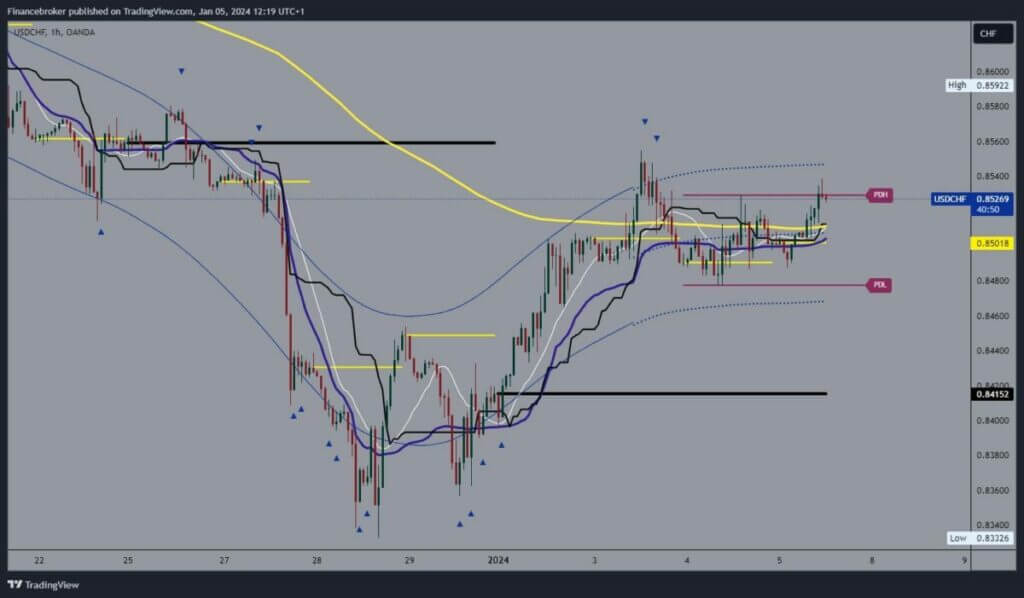
This week has been very positive for USDCHF. We started at 0.84150 and on Wednesday, we saw a high forming at 0.85600. There, we encounter resistance and make a pullback, but now to support at the 0.84800 level. From there, we move into a positive consolidation and climb above 0.85000 and the EMA50 moving average. A move above could increase optimism in the further recovery of USDCHF and climb to December’s higher levels.
Potential higher targets are 0.85600 and 0.85800 levels. We need a negative consolidation and pullback to the previous support at the 0.84800 level for a bearish option. A fall below the EMA50 increases the bearish pressure, and we can expect a break below the support level and the formation of a new low. Potential lower targets are 0.84600 and 0.84400 levels.

USDJPY chart analysis
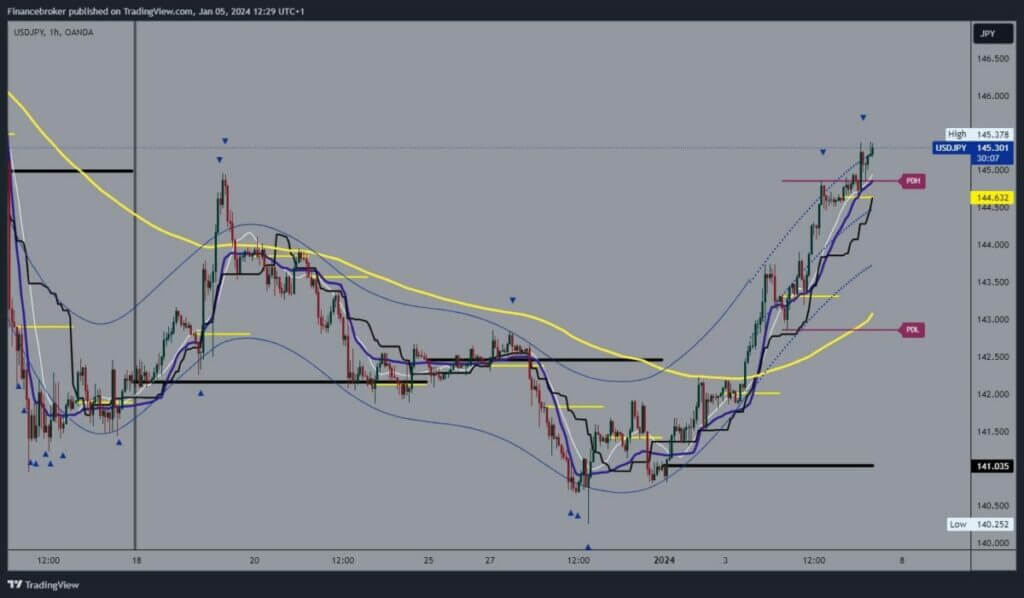
USDJPY managed to recover significantly this week. We started the trading week at the 141.00 level and are now at 145.30. We managed to form a new high compared to the previous one from December 19. During the Asian session, the pair gained support at 144.50, followed by an impulse and a jump to a new high. Today’s movement tells us that we could see a continuation to the bullish side and the formation of a new high. Potential higher targets are 145.50 and 146.00 levels.
We need a negative consolidation and pullback to support a bearish option at the 144.50 level. A break below is the first step towards further decline, and potential lower targets are 144.00 and 143.50 levels. The EMA50 moving average is in the zone around 143.00 levels; there, we could expect greater support and stop the bearish trend.


