USDCHF and USDJPY: USDJPY is near breakout above 154.00
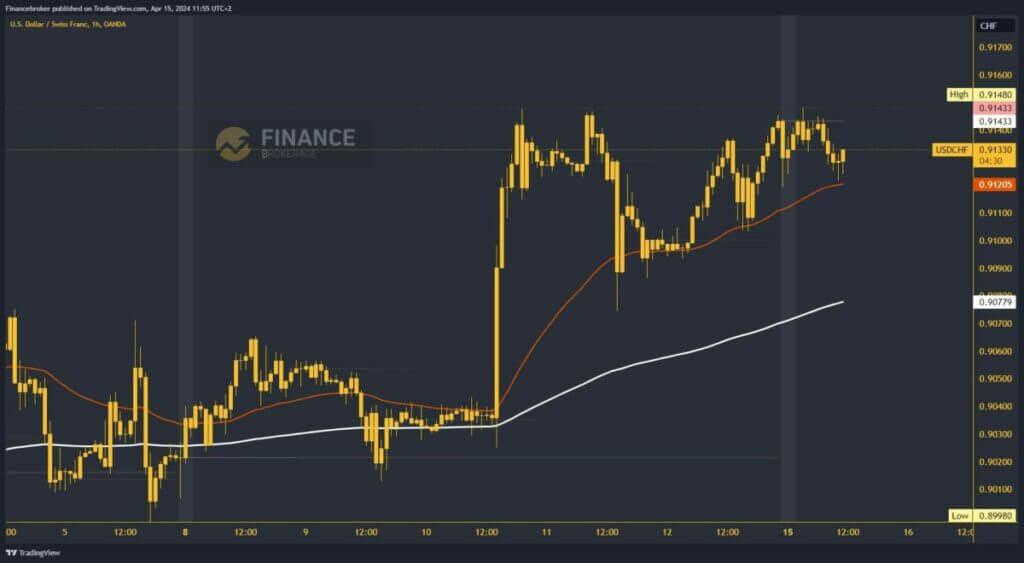
- During the Asian trading session, USDCHF held high above the 0.91400 level.
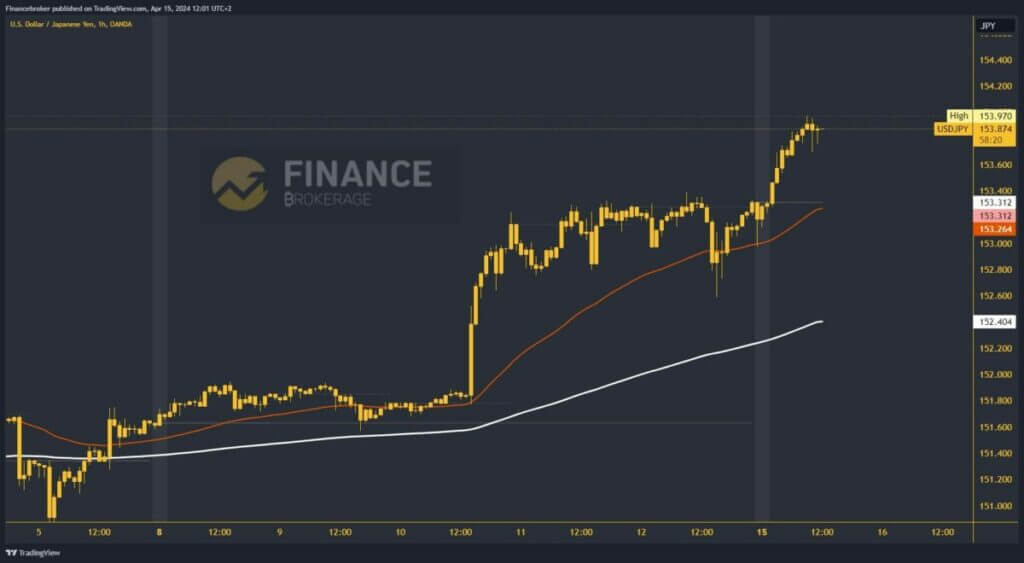
- During the Asian trading session, USDJPY broke through last week’s resistance zone at 153.40.
USDCHF chart analysis
During the Asian trading session, USDCHF held high above the 0.91400 level. As we got closer to the EU session, the dollar started to weaken, and we saw a slight pullback to the 0.91200 level. Here, we come across the EMA50 moving average, which provides us with support, not allowing us to fall below its line. We are back above 0.91300, and now we need a continuation of the positive consolidation to move to the bullish side again.
Potential higher targets are 0.91500 and 0.91600 levels. For a bearish option, we need a negative consolidation and pullback below 0.91200 and EMA50. With that, we break through the previous bullish formation and turn to the bearish side. Potential lower targets are 0.91100 and 0.91000 levels.

USDJPY chart analysis
During the Asian trading session, USDJPY broke through last week’s resistance zone at 153.40. After that, we saw a bullish consolidation and a rise to 153.97 levels. We are currently very close to reaching the 154.00 level. Depending on the momentum, we could jump to a new higher high. Potential higher targets are 154.20 and 154.40 levels.
For a bearish option, we need a negative consolidation and a pullback of USDJPY down to the 153.40 support zone. Falling below this level would return us to the movement zone from the end of last week. There, we test the EMA50 moving average, and if we do not get its support, a drop to a new weekly low will follow. Potential lower targets are 153.20 and 153.00 levels.


