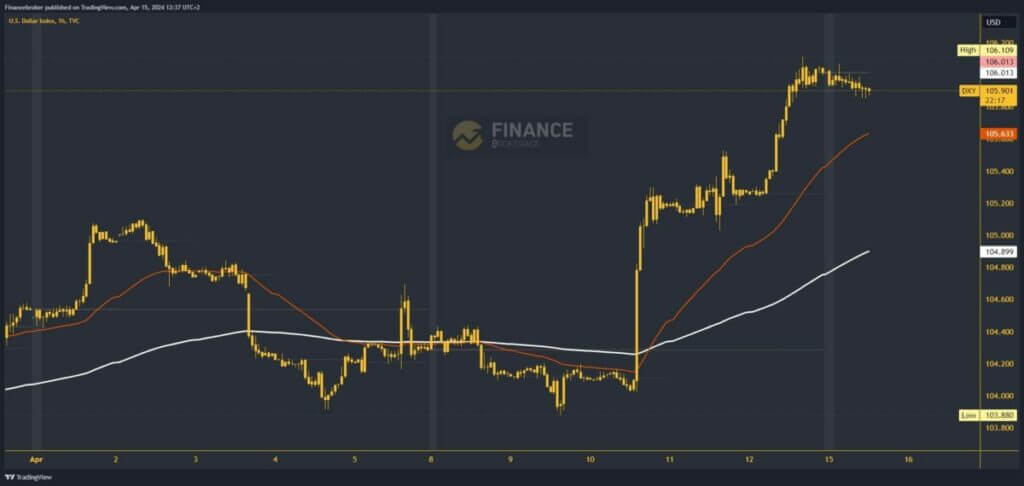
The dollar index is above 106.00, now we expect a pullback
- On Friday, we saw the dollar index above the 106.00 level for the first time this year.
Dollar index chart analysis
On Friday, we saw the dollar index above the 106.00 level for the first time this year. A new high was formed at the 106.10 level. During this morning’s Asian trading session, the index was in a slight bearish consolidation, going down to 105.85 levels. The dollar continued to weaken in the EU session, and we are likely to reach a new daily low. Potential lower targets are $105.60 and $105.40 levels.
In the zone around 105.60, the dollar index encounters the EMA50 moving average, which could stop or slow down a potential pullback. EMA200 is even lower in the zone, around 104.90 levels. We need a positive consolidation and a move above the 106.00 level for a bullish option. This brings us back above the weekly open price, and we expect to move further to the bullish side after that.

Is this the end of the bullish trend or just a respite?
First, we look at last week’s high at the 106.10 level. A stronger bullish impulse could easily push us to a new higher high. Potential higher targets are 106.20 and 106.40 levels. We cannot even rule out a visit to the zone around 107.00 as we have broken above the 106.00 November high.
Today, we will have news on US Retail Sales and Core Retail Sales in the US session. On Tuesday morning, the data on China’s GDP will be published, and in the afternoon, we have a speech by Fed Chairman Jerome Powell. On Wednesday we have the release of data on British inflation and Eurozone inflation.


