USDCHF and USDJPY: support for USDCHF at 0.89700 level
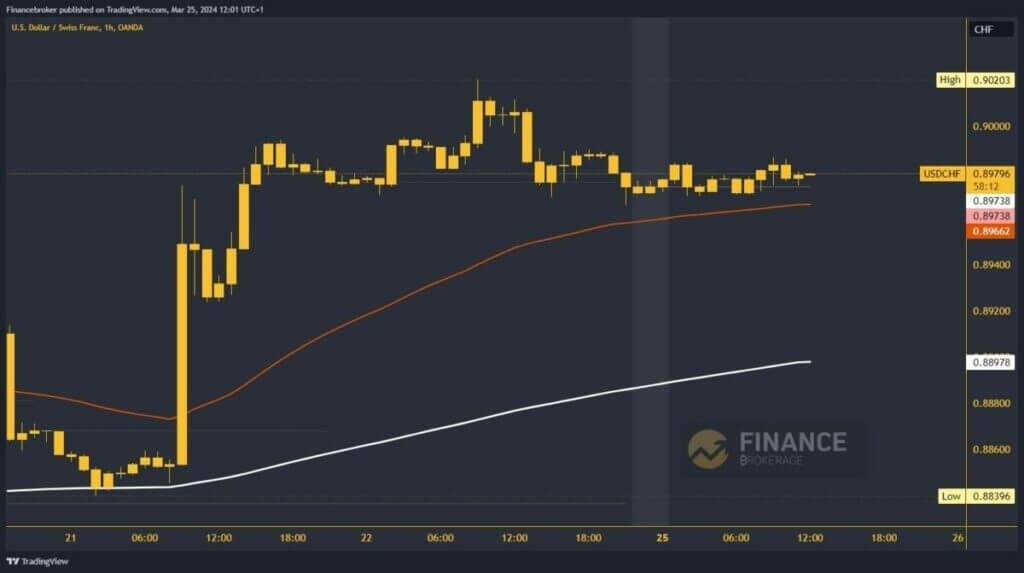
- As of Thursday afternoon, this USDCHF pair is moving sideways in the 0.89650-0.90000 range.
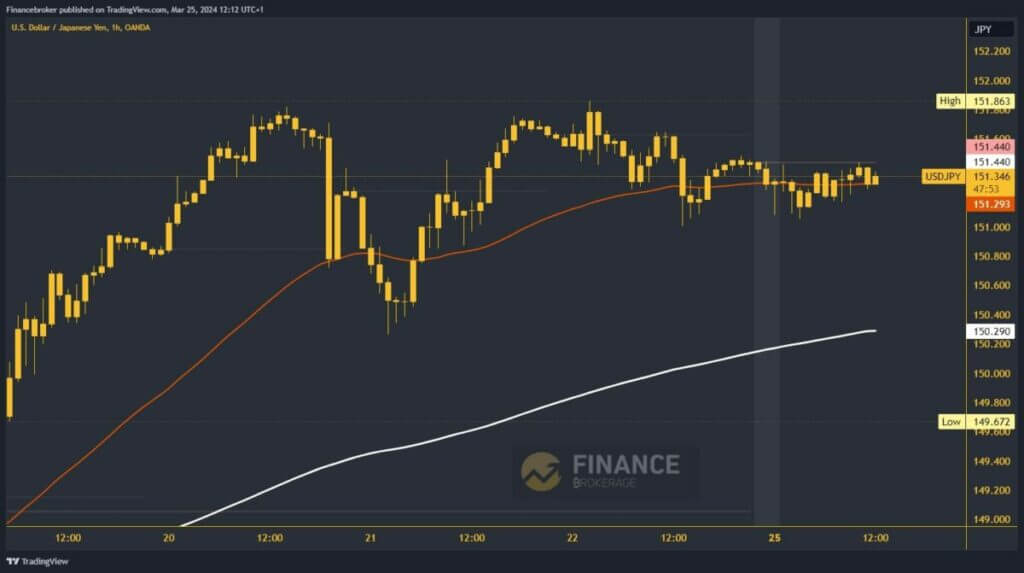
- During the Asian session, USDJPY moved in the 151.00-151.40 range.
USDCHF chart analysis
As of Thursday afternoon, this USDCHF pair is moving sideways in the 0.89650-0.90000 range. The interest rate cut by the Swiss National Bank had a negative impact on the Swiss franc. During this morning’s Asian session, the pair moved in an even narrower range at 0.89700-0.89880. Now, we need an upward impulse that would test 0.90000 and, with that move, indicate a further bullish trend.
Potential higher targets are 0.90100 and 0.90200 levels. We need a bearish impulse below the 0.89650 level for a bearish option. With that step, we pull back below the EMA50 moving average, increasing the pressure on USDCHF. After that, we can expect to see a continuation of the pullback and drop to lower levels. Potential lower targets are 0.89600 and 0.89500 levels.

USDJPY chart analysis
During the Asian session, USDJPY moved in the 151.00-151.40 range. We are currently at 151.30 and approaching the weekly open price at the 151.44 level. With the jump above, we move to the bullish side, form a new daily high and continue this morning’s bullish consolidation with the 151.00 level. After that, we look towards 151.60, the previous high from Friday.
If we jump over that obstacle, we will have the opportunity to test last week’s high at the 151.86 level. Potential higher targets are 152.00 and 152.10 levels. For a bearish option, we need a break below the 151.00 level. With that, we go to a new daily low and get confirmation of the current bearish momentum. Potential lower targets are 150.80 and 150.60 levels. The EMA200 moving average is in the zone around 150.30 levels.


