USDCAD and USDCNH: USDCNH in decline below 7.18000 level
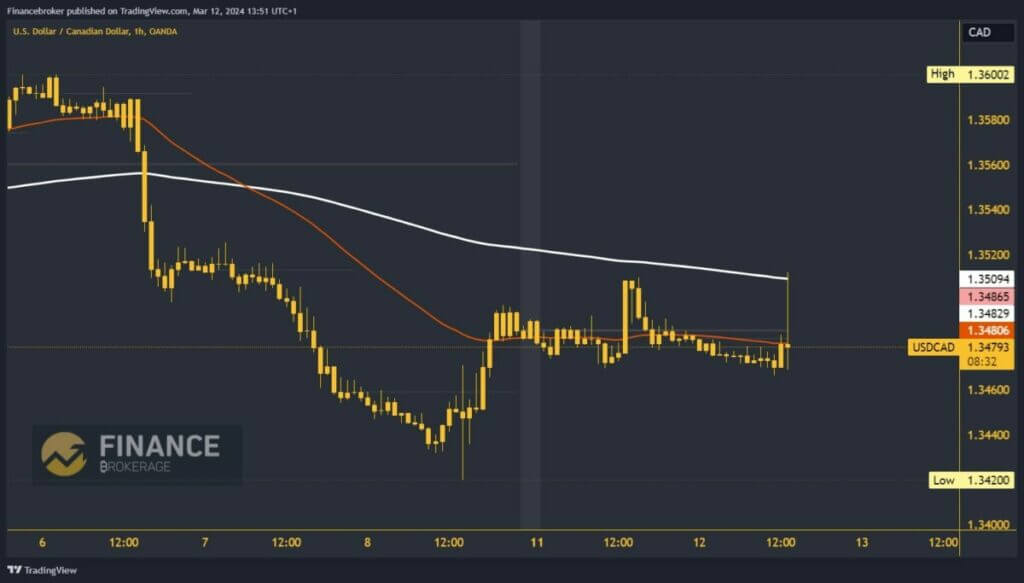
- USDCAD recovered this week from Friday’s decline to 1.34200 levels.
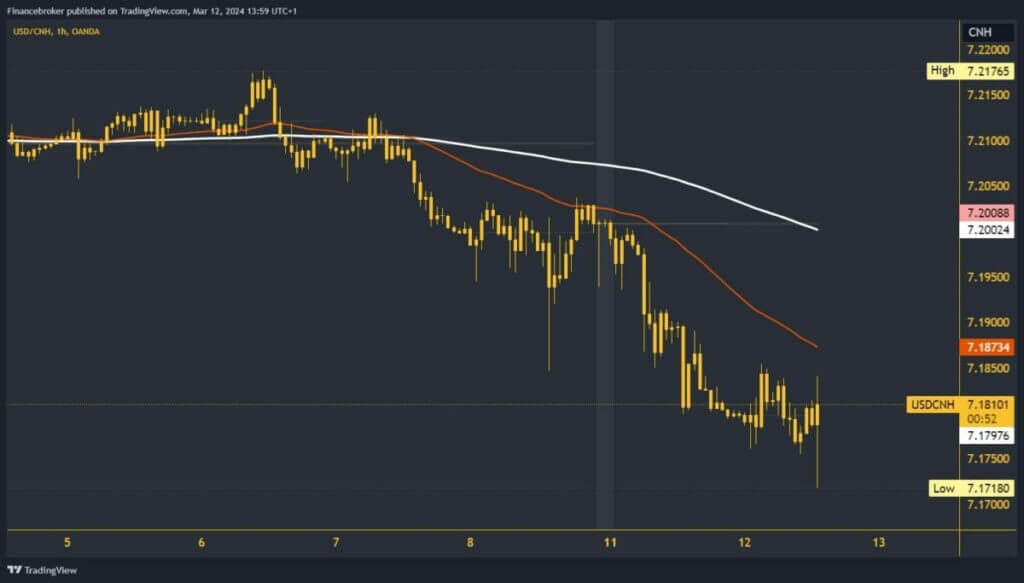
- USDCNH has been pulling back since the start of this week.
USDCAD chart analysis
USDCAD recovered this week from Friday’s decline to 1.34200 levels. Yesterday, we moved above the 1.34600 level and formed a weekly high at 1.35100. After that, pairs pull back during this morning’s Asian session again below 1.34700, retesting the support zone. On the upside, we have the EMA200 moving average and would have to break above it for further continuation to the bullish side.
Potential higher targets are 1.35200 and 1.35300 levels. New pressure in the support zone could negatively affect the further development of events. A break below leads to a drop to a new weekly low and this gives us confirmation of bearish momentum. Potential lower targets are 1.34500 and 1.34400 levels.

USDCNH chart analysis
USDCNH has been pulling back since the start of this week. After falling below the 7.2000 level, a bearish consolidation was initiated that has been going on for two days. At this moment, we are falling to a new weekly low at 7.17180. The dollar is currently under pressure from the news about rising inflation on American soil. This could put additional pressure on the already weakened dollar and send USDCNH to even lower levels.
Potential lower targets are the 7.17500 and 7.1700 levels. For a bullish option, we need a return and stabilization above the 7.18500 level. This completes the formation of the bottom, and we have the opportunity to initiate a bullish consolidation. Potential higher targets are the 7.19000 and 7.19500 levels. EMA200 remained higher in the zone, around 7.20000 levels.


