USDCAD and USDCNH: USDCAD stops below the 1.36200 level
- During the Asian trading session, USDCAD recovered from 1.35675 to 1.36100 levels.
- USDCNH has been in a steady bullish consolidation since Monday.
USDCAD chart analysis
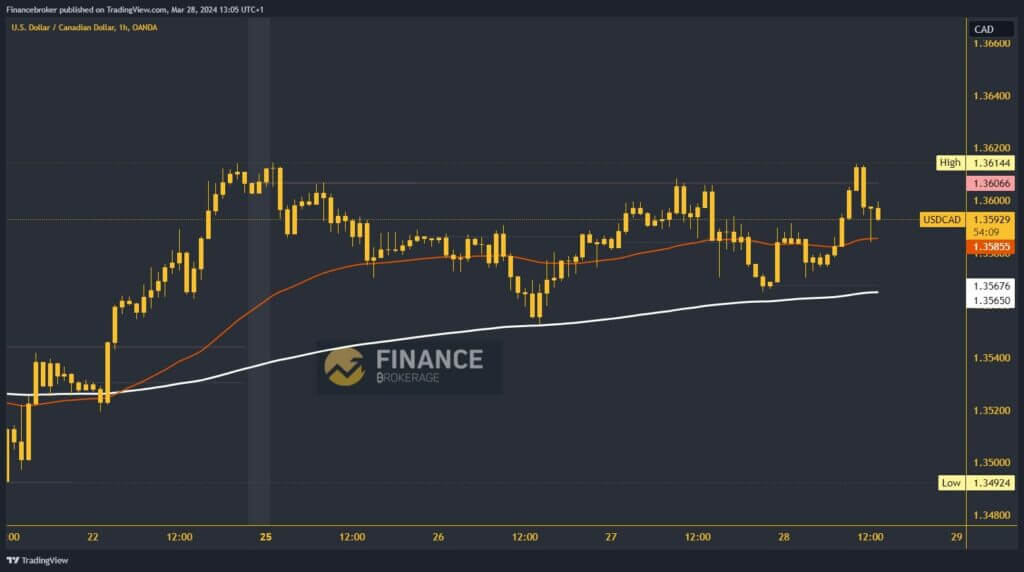
During the Asian trading session, USDCAD recovered from 1.35675 to 1.36100 levels. The pair regained its grip on the weekly open price and is getting closer to breaking above to a new weekly high. We have EMA50 and EMA200 moving average support, and everything is on the dollar side. Potential higher targets are 1.36200 and 1.36300 levels.
We first need a negative consolidation and pullback below the 1.35800 level for a bearish option. With that step, we first fall below the EMA50 moving average. Bearish pressure is increasing, which could take us down to 1.35650 and the EMA200 moving average. Thus, we would test the moving average for the third time this week. This time, a breakout below and a drop to a new daily low could occur. Potential lower targets are 1.35600 and 1.35400 levels.

USDCNH chart analysis
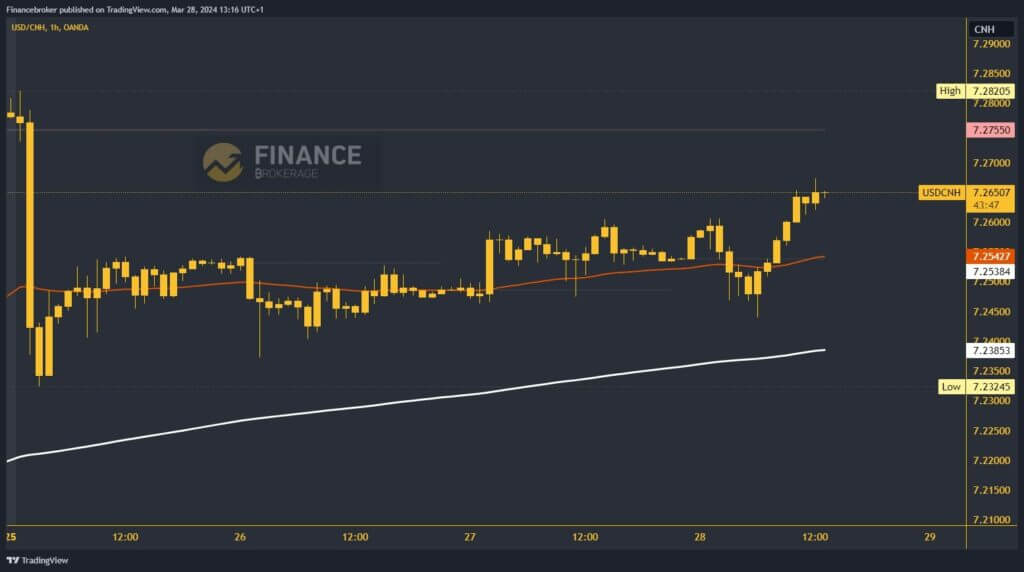
USDCNH has been in a steady bullish consolidation since Monday. In the first hours of market opening this week, the pair slipped from 7.28205 to 7.23245 levels. After receiving support at that level, a bullish consolidation was initiated that continues today. Today’s high is at the 7.26750 level, and we expect to continue above for the rest of the day. Potential higher targets are 7.27000 and 7.27500 levels.
By returning to the zone around 7.27500, we would be close to testing the weekly open price. For a bearish option, we need a negative consolidation and pullback below 7.26000 as a first step. This would trigger a decline, and USDCNH would be forced to look downwards for a new support level. Potential lower targets are 7.25000 and 7.24500 levels.


