USDCAD and USDCNH: USDCAD slipped to 1.34400 yesterday
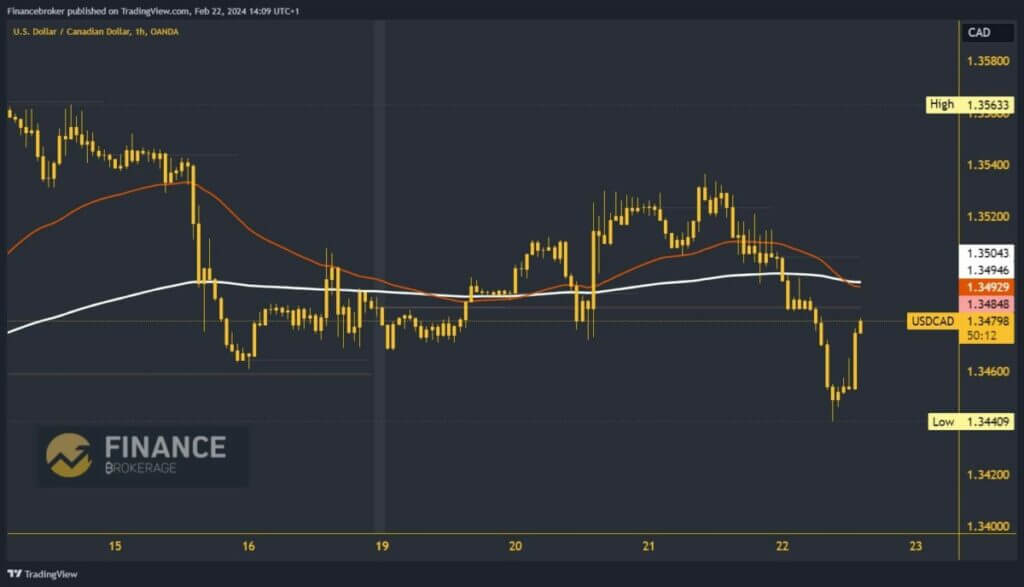
- This week’s bullish trend for USDCAD was stopped yesterday at 1.35364.
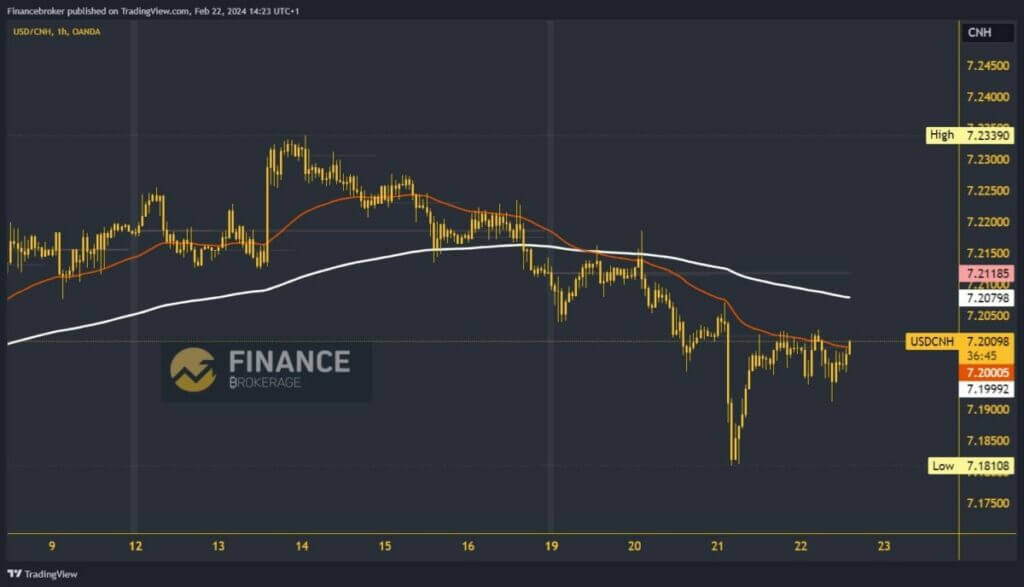
- This week brought us USDCNH down to a three-week low at 7.18108 level.
USDCAD chart analysis
This week’s bullish trend for USDCAD was stopped yesterday at 1.35364. We started to pull back from that level and form a weekly low this morning at the 1.34409 level.
The fall stopped there, and the pair started a bullish consolidation and climbed up to 1.34780 levels. We expect a continuation of this consolidation, a climb to 1.35000, and a test of the EMA200 moving average.
A jump above both resistance levels would see the USDCAD move to the positive side. With EMA200 support, it could continue to recover to the bullish side. Potential higher targets are 1.35200 and 1.35400 levels.
We need a pullback and a retest of this morning’s support for a bearish option. Below, we would be under bearish pressure to continue the decline and move it even lower.

USDCNH chart analysis
This week brought us USDCNH down to a three-week low at 7.18108 level. Last Friday, we saw a pullback below the EMA200; on Monday, we tried to break through above, but it ended unsuccessfully.
Tuesday strengthens the bearish momentum and pushes us below the 7.20000 level, and on Wednesday, we make the February low at 7,18108. After that, the pair manages to hold above that level and initiate a recovery to the 7.20000 level.
We are very close to testing the EMA200 at the 7.20500 level, and a break above it would return us to the bullish side. Potential higher targets are 7.21000 and 7.22000 levels. If we fail in that intention, we return to the bearish side and turn to the previous low. Potential lower targets are 7.19000 and 7.18000 levels.


