The Silver Chart Is Much More Bullish Than The Gold Chart
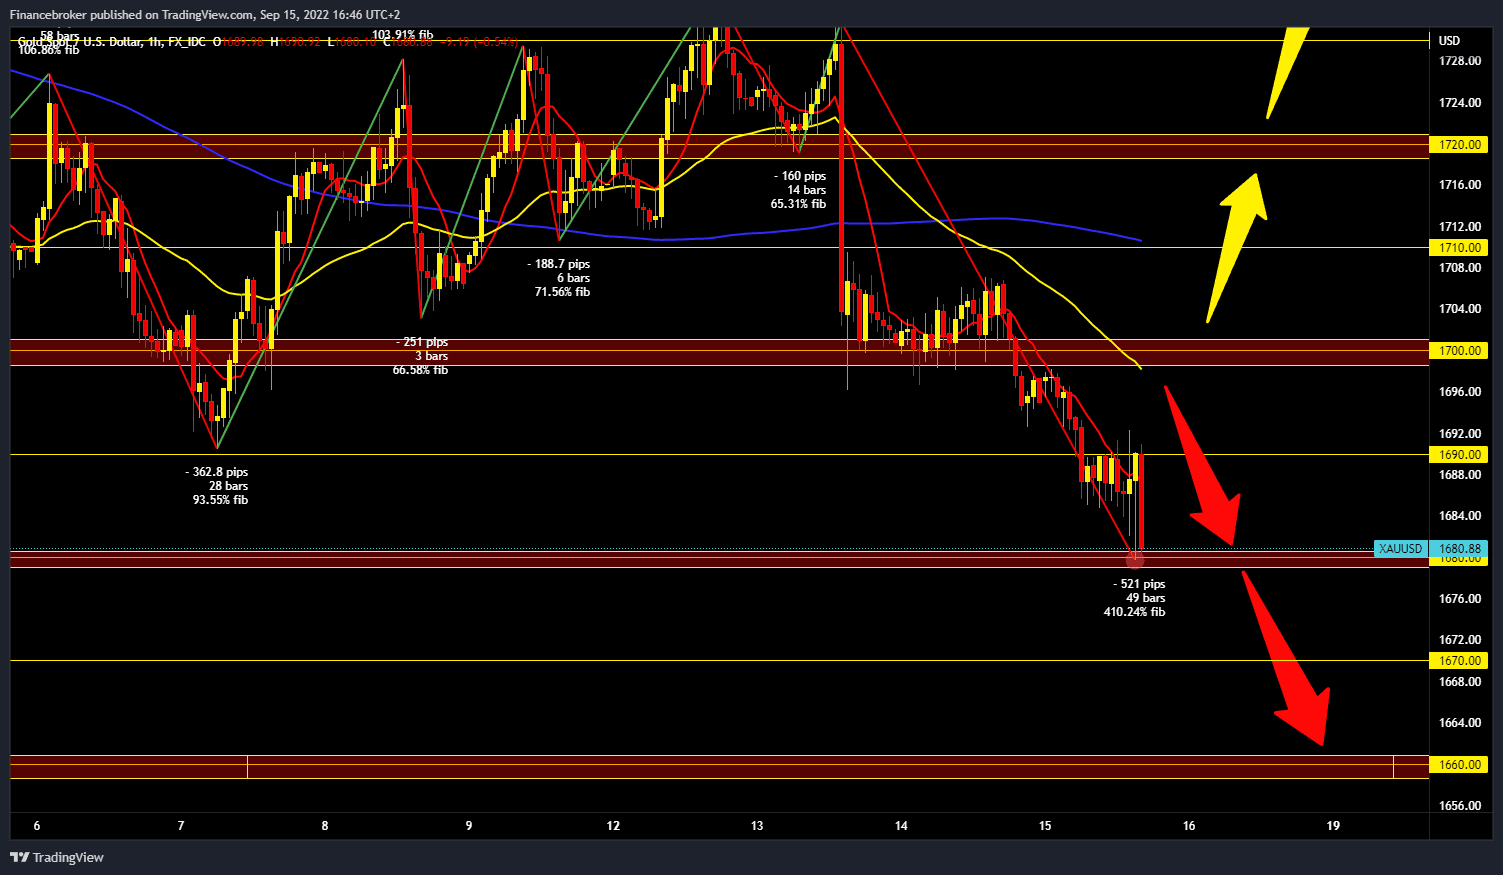
- During the Asian trading session, the price of gold continued to slide below the $1,700 level.
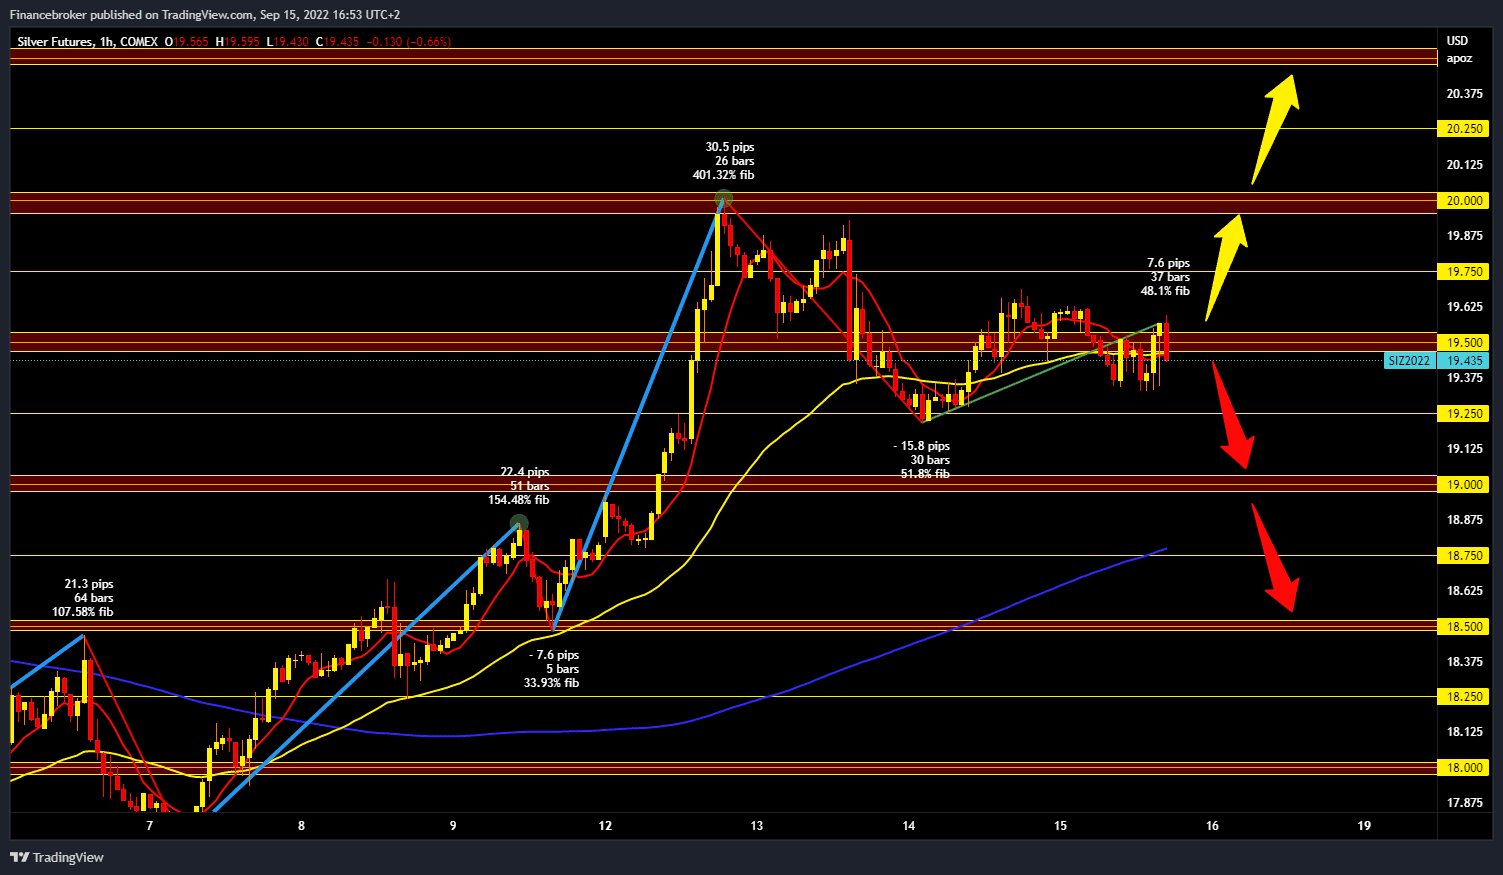
- The silver chart is much more bullish than the gold chart. We are hovering around the $19.50 level for the second day without major fluctuations.
Gold chart analysis
During the Asian trading session, the price of gold continued to slide below the $1,700 level. We fell very quickly to the $1690 level, and we didn’t stop there because we are now at the $1680 level. The last time we were there was on July 21. We need to continue this negative consolidation and a price break below the current support level for a bearish option. Potential lower targets are $1670 and $1660 levels. For a bullish option, we need a new positive consolidation and a return above the $1690 level. In the continuation, we could climb up to $1700 and look for new support there. A price break above could have a positive effect and continue the recovery. Potential higher targets are $1710 and $1720 levels.
Silver chart analysis
The silver chart is much more bullish than the gold chart. We are hovering around the $19.50 level for the second day without major fluctuations. For now, we do not see the formation of a new lower low, and we could expect a continuation of the recovery of silver. We need a positive consolidation and stay above the $19.50 level for a bullish option. In the following, we will see a bullish impulse up to the $19.75 level, and if we manage to go above it, the next target is $20.00, the maximum from the beginning of the week. For a bearish option, we need a negative consolidation and price drop to the previous low at the $19.25 support level. If we fail to find support there, we look for the next one at the $19.00 level.