The price of Gold is holding above $2130, what about Silver?
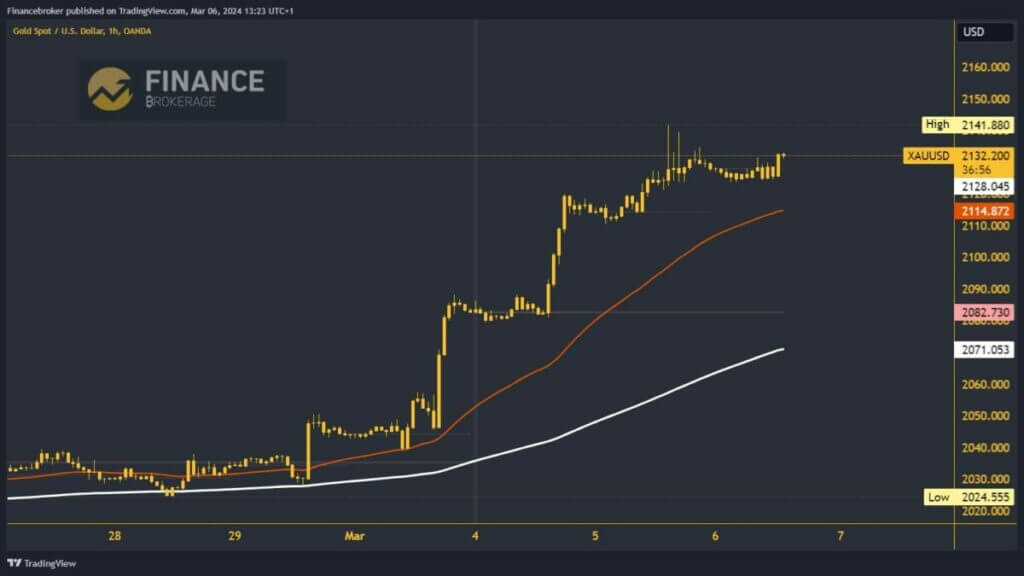
- The price of gold already broke the barrier at the $2100 level on Monday, forming a new high at the $2120 level.
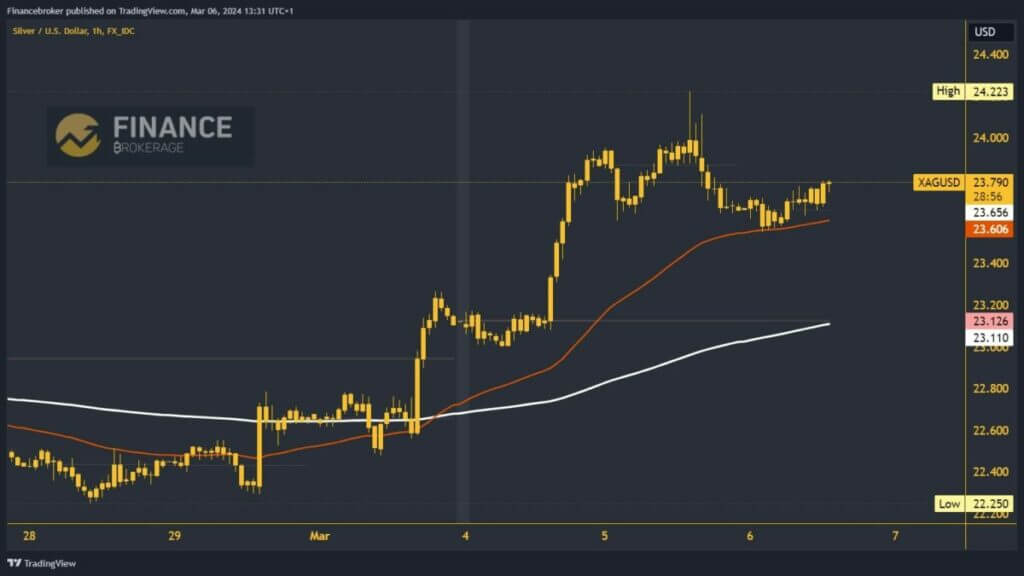
- Silver climbed to the $24.22 level yesterday for the first time this year.
Gold chart analysis
The price of gold already broke the barrier at the $2100 level on Monday, forming a new high at the $2120 level. Then, we saw consolidation and support at the $2110 level. From there, we start a new bullish consolidation, rising to a new weekly high at $2141. During the previous Asian trading session, the price of gold remained stable above the $2120 level and started another bullish consolidation, moving us above the $2130 level.
We expect to see the price at $2140 by the end of the day and maybe at a new high. Potential higher targets are $2145 and $2150 levels. We need a price drop below the $2130 level for a bearish option. With that, we would take the first step on the bearish side. Then, we look at the next lower zone with support at the $2110 level. A break below this level would significantly increase the bearish pressure on the price of gold. Potential lower targets are $2100 and $2090 levels.

Silver chart analysis
Silver climbed to the $24.22 level yesterday for the first time this year. We stopped there, and a bearish consolidation followed, followed by a pullback to support at the $23.50 level. During the Asian trading session, silver found support at that level and began a bullish consolidation, moving up to the $23.80 level. We need a stronger impulse to break above and form a new daily high. Potential higher targets are the $23.90 and $24.00 levels.
For a bearish option, the price of silver would have to drop below the Asian low price of $23.50. With that, we fall to a new daily low, and I get a confirmation of the bearish momentum. After that, we expect to start a further pullback and descend to lower support levels. Potential lower targets are $23.40 and $23.20 levels. Additional support at $23.20 is the EMA200 moving average.


