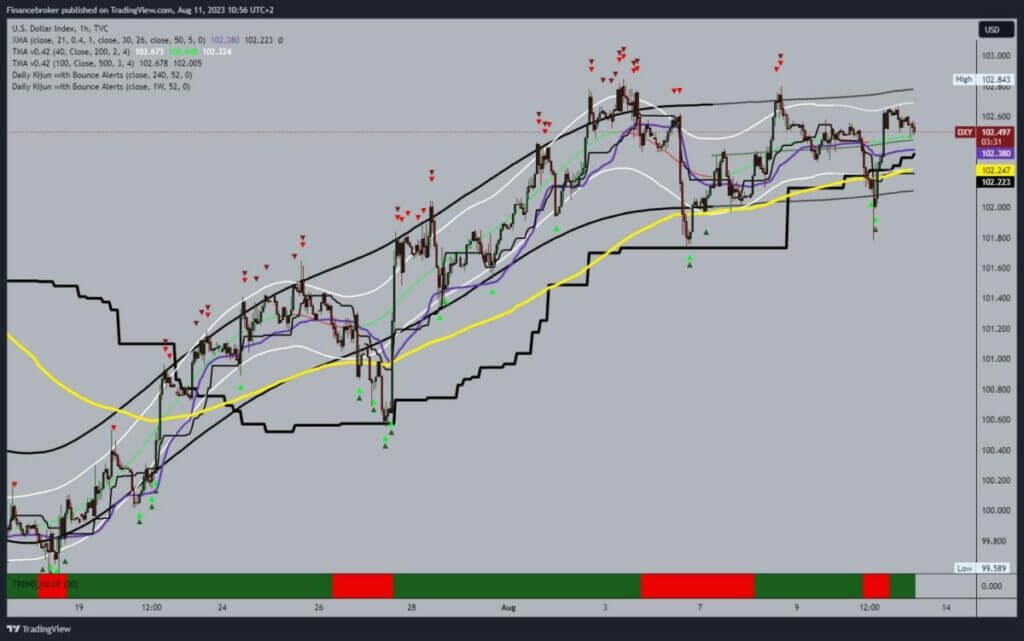
The dollar index remains high above the 102.00 level
- This week, the dollar index moved in the 101.80-102.85 range.
Dollar index chart analysis
This week, the dollar index moved in the 101.80-102.85 range. On two occasions, we tried to break through the break at 102.85, but the attempts ended in failure. During today’s Asian trading session, the dollar encountered an opening at the 102.65 level and began a slight retreat to the 102.45 level.
Nothing critical for now, but soon, we come across the 102.25 level and support in the EMA50 moving average. If the dollar were to break below this level, it would bring us back to testing this week’s support zone. Increased pressure below 102.00 could make a break below 101.80 and form a new weekly low. Potential lower targets are 101.60 and 101.40 levels.
We need a positive consolidation and a return around the 102.80 resistance zone for a bullish option. Then we need a breakout above and to hold up there. After that, the dollar would have to start a new bullish consolidation, and thus, we would continue with further recovery. Potential higher targets are 103.00 and 103.20 levels.
From today’s news for the dollar index, we will single out The Producer Price Index. It is the main indicator of consumer price inflation, which accounts for the largest part of total inflation.


