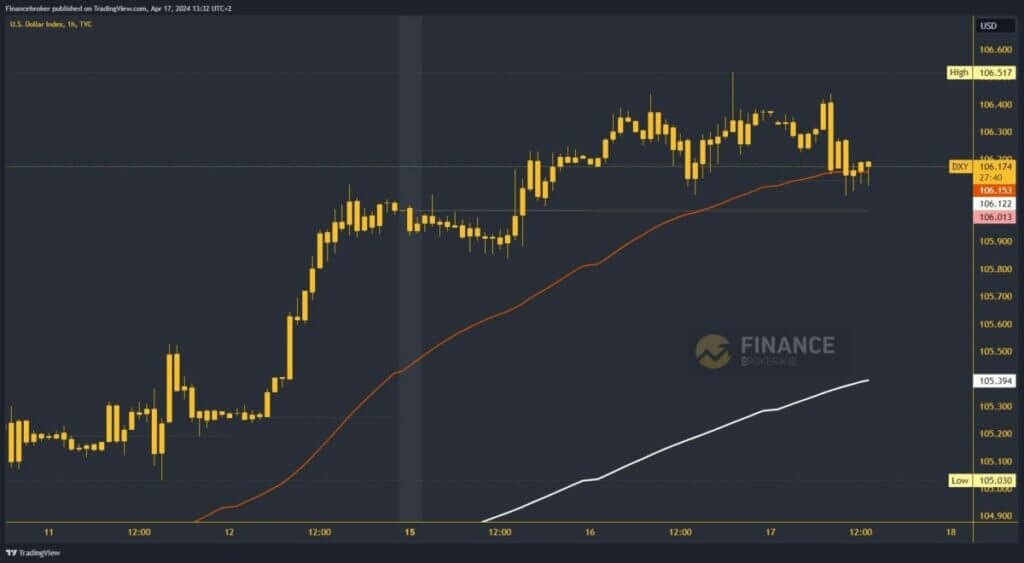
The dollar index is successfully maintained above 106.00
- The new annual high value of the dollar index was formed on Tuesday at the 106.51 level.
Dollar index chart analysis
The new annual high value of the dollar index was formed on Tuesday at the 106.51 level. We remain below that level today and slowly move away to the bearish side. Now the index is at the 106.10 level and it is very possible that we will see the testing of the 106.00 level, ie the weekly open price. The EMA50 moving average creates additional pressure here, which is slowly directing the dollar to the bearish side.
If the dollar index falls below the 106.00 level, the next important level of support is at 105.90 because we already got the first support there on Monday. By falling below, we go to a new weekly low, and there are high chances that we will continue the retreat. Potential lower targets are 105.80 and 105.70 levels.
Will support at 106.00 hold, or do we go below?
With the support of EMA50, the dollar index could start a new positive consolidation. With a return to 106.40, we will be on the verge of testing the previous high. For that, we need another impulse, and after that, we go to a new weekly high. Potential higher targets are 106.60 and 106.70 levels.
This morning we had news on UK and Eurozone inflation. The data showed that British inflation rose more than expected, while Eurozone inflation aligned with the forecast. In the afternoon in the US session, the main news is Crude oil inventories. On Thursday, we highlight: US Initial Jobless Claims, Philadelphia Fed Manufacturing Index and Existing Home Sales. And we have the Japanese CPI at the end of the week on Friday.


