The dollar index could continue above 103.00 this week
- At the beginning of this week, the dollar index remains positive, above the EMA50 moving average and the 102.30 level.
Dollar index chart analysis
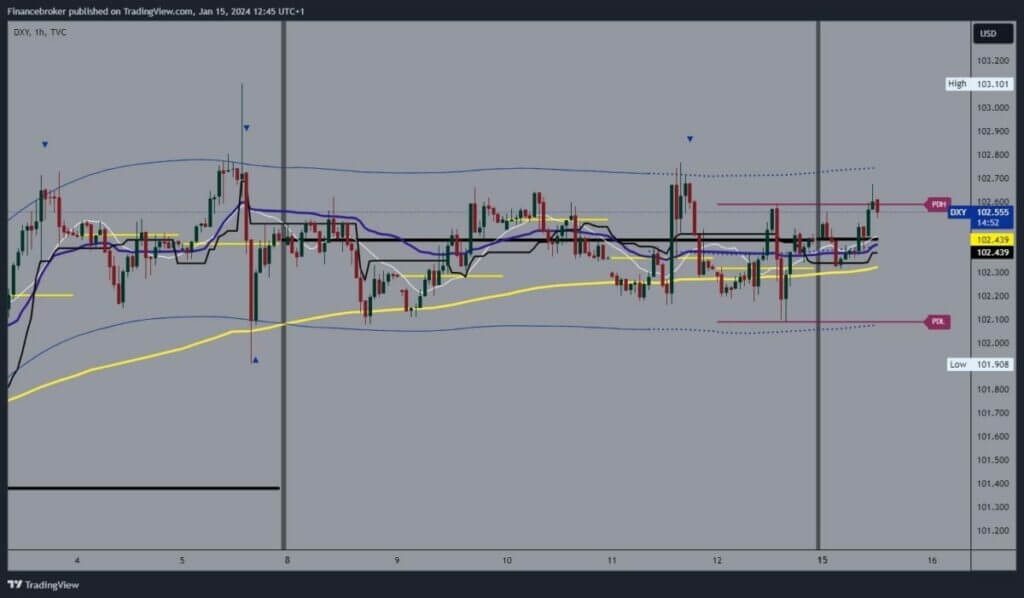
At the beginning of this week, the dollar index remains positive, above the EMA50 moving average and the 102.30 level. During the Asian trading session, we saw an attempt to pull back and test these levels, and the dollar managed to resist them and form a bottom from which it started to recover. With bullish consolidation, it rose to 102.67.
There we form today’s low before the start of the US session. If the dollar manages to hold above 102.50, it would be in a good position for a new impulse and jump to a new high. Potential higher targets are 102.70 and 102.80 levels.

Does a drop below the EMA50(4h) mean a drop in the dollar?
A pullback below the EMA50 moving average would put the dollar under pressure to test last week’s 102.10-102.20 support zone. The new decline increases the pressure on the dollar, reinforcing the bearish momentum, which would allow us to see a breakout below and a new two-week low formation. Potential lower targets are 102.00 and 101.90 levels.
Today is a holiday in the US, Martin Luther King Jr. Day. The stock exchange will be closed, and reduced volatility of all currencies and stocks is expected. Tomorrow, in the EU session, we will highlight German inflation for December. Expectations are that there will be an increase in inflation compared to the previous month. Wednesday is full of news, first Chinese GDP, then British CPI and Eurozone CPI, while in the afternoon, we have Retail Sales in the US session. On Thursday and Friday, news from the US market is dominated by the Philadelphia Fed manufacturing index, initial Jobless Claims and Oil inventories.


