Solana and Cardano: Solana is moving towards the 23.50
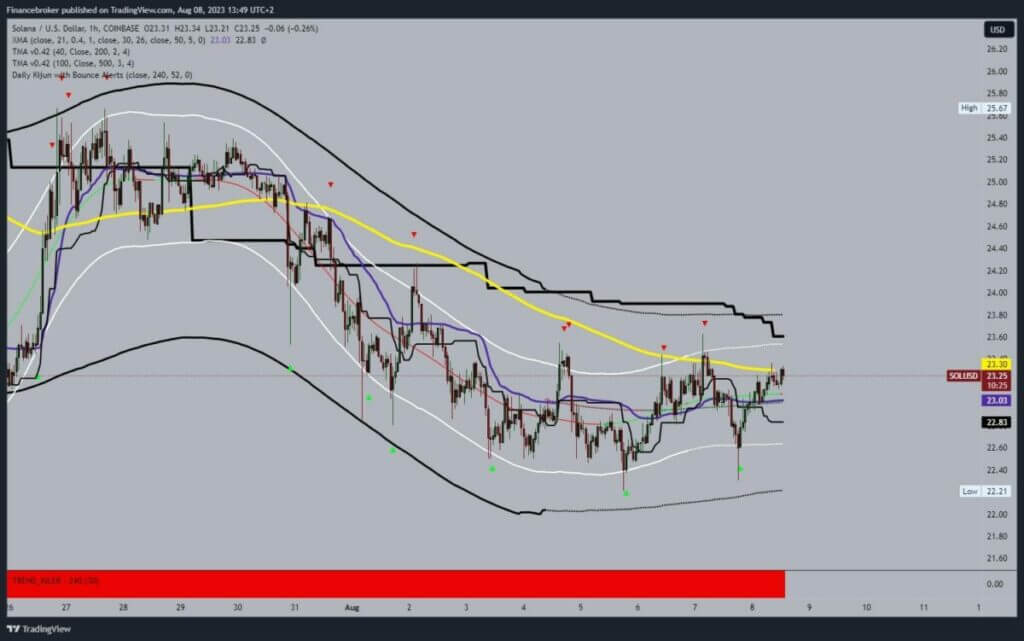
- The price of Solana is today in a bullish consolidation from yesterday’s low at the 22.20 level.
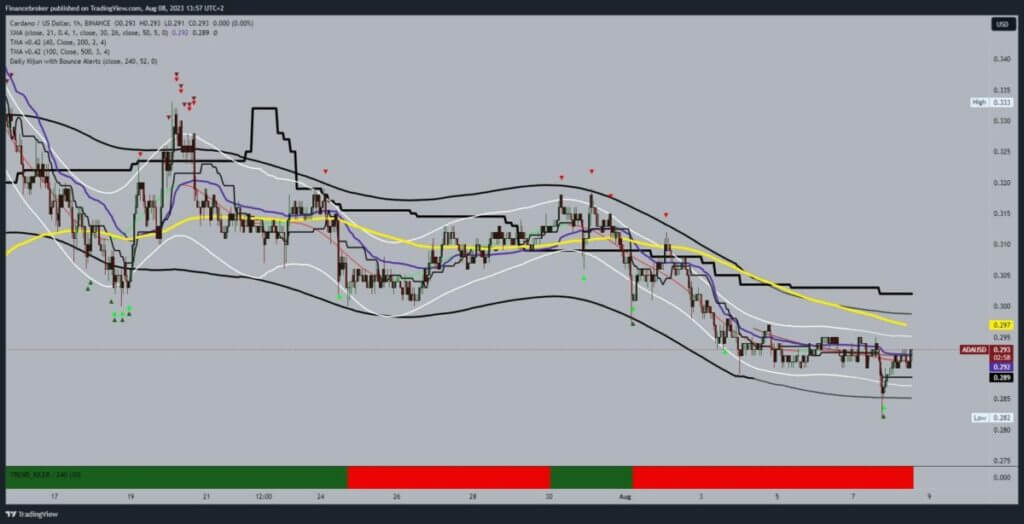
- The price of Cardana yesterday fell to a new August low at the 0.282 level.
Solana chart analysis
The price of Solana is today in a bullish consolidation from yesterday’s low at the 22.20 level. We are currently at the 23.30 level, and here we are now testing the EMA50 moving average. It is very possible that we will see a break above and a continuation to the bullish side with the formation of a new high. Potential higher targets are 23.60 and 23.80 levels.
We need a negative consolidation and a price pullback to the 23.00 level for a bearish option. A break below this support would mean a continuation to the bearish side. Potential lower targets are 22.80, 22.60 and 22.40 levels.

Cardano chart analysis
The price of Cardana yesterday fell to a new August low at the 0.282 level. After that, we see consolidation and recovery above the 0.290 level. Today, the price mostly moved above the 0.290 level, and we could expect to see a continuation of the recovery by the end of the day. Potential higher targets are 0.295 and 0.300 levels. Another obstacle to the bullish option is the EMA50 moving average in the zone around the 0.295 level.
We need a negative consolidation and pullback below the 0.2900 level for a bearish option first. After that, we could expect to see a visit to the 0.285 support level. Potential lower targets are 0.280 and 0.275 levels.


