Solana and Cardano: Solana is holding above the 19.20 level
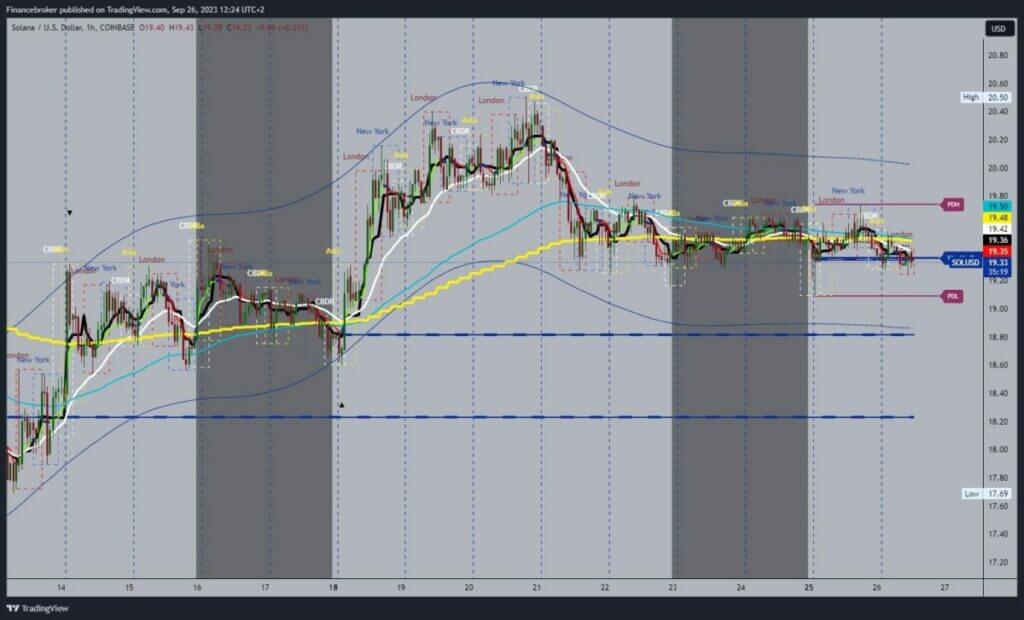
- The price of Solana is in a sideways movement for the fifth day in a row in the 19.30-19.80 range.
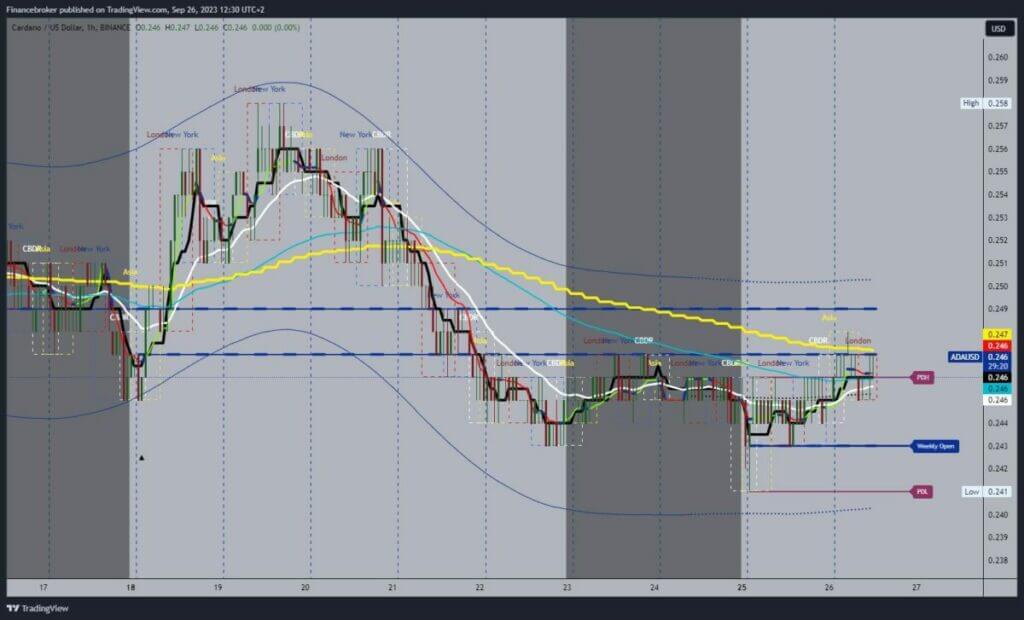
- Cardano’s price is recovering after yesterday’s pullback to the 0.241 level.
Solana chart analysis
The price of Solana is in a sideways movement for the fifth day in a row in the 19.30-19.80 range. We are currently at the 19.30 support level, while the bearish pressure is slowly increasing the longer we stay around that level. This could lead to a breakout below, the formation of a new low, and confirmation of a bearish option. Potential lower targets are 19.00 and 18.80 levels.
For a bullish option, we need a positive consolidation and a return of the price above the 19.60 level. After that, we would be able to test the open at the 19.80 level. A break above would be very beneficial for us to continue on the bullish side. Potential higher targets are 20.00 and 20.20 levels.
Cardano chart analysis
Cardano’s price is recovering after yesterday’s pullback to the 0.241 level. From that place, we see the beginning of bullish consolidation and price recovery to the 0.247 level. We need a break above if we want to see a continuation to the bullish side. This would give us support in the EMA50 moving average. After that, the price would have the opportunity to start a further recovery. Potential higher targets are 0.249 and 0.250 levels.
We need a negative consolidation and a return to the support zone at the 0.243 level for a bearish option. A break below would indicate that the price does not have the strength to recover and that we continue to retreat to lower levels. Potential lower targets are 0.240 and 0.239 levels.


