Solana and Cardano: Cardano pulls back below 0.3100
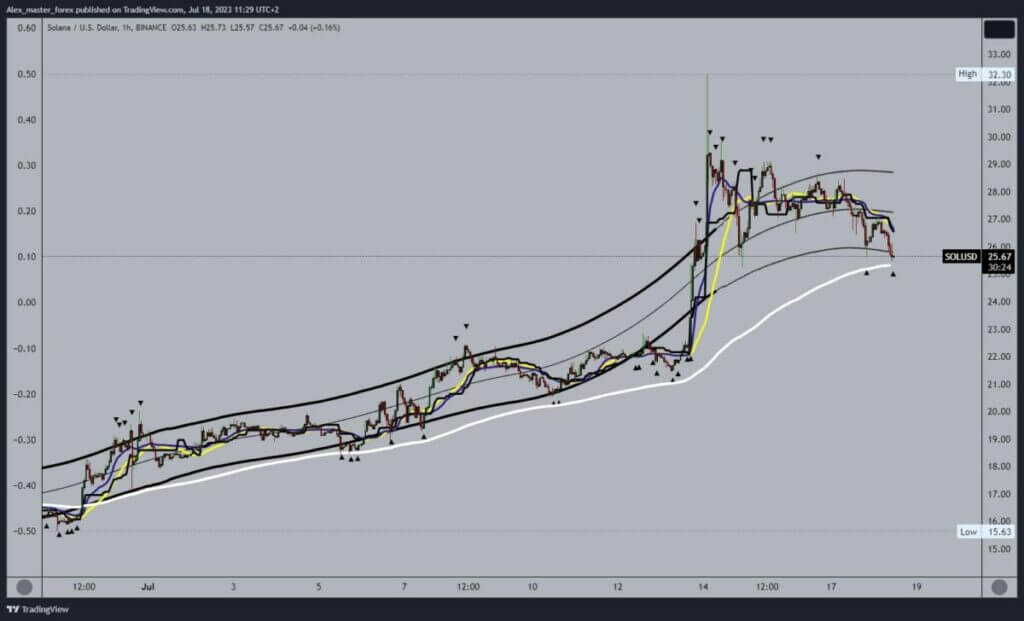
- The price of Solana is in a bearish trend after Friday’s jump to the 32.30 level.
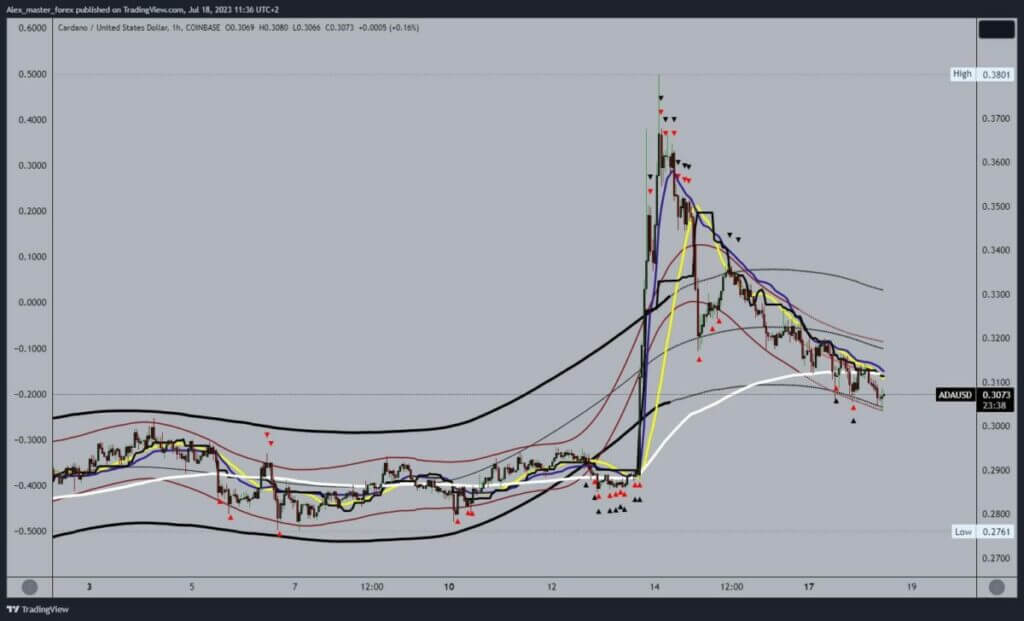
- The price of Cardana is in a bearish trend from the 0.3801 level.
Solana chart analysis
The price of Solana is in a bearish trend after Friday’s jump to the 32.30 level. We are in a pullback for the fourth day in a row, with a drop to 25.50 this morning. The EMA50 moving average is potential additional support, which provided support for the price during July. A break below could signal a further decline as we would fall below the EMA50 moving average. Potential lower targets are 25.00 and 24.00 levels.
We need a positive consolidation and price growth to the 27.00 level for a bullish option. Then, we need to hold above there and try to continue the consolidation to the bullish side. Potential higher targets are 28.00 and 29.00 levels. Up there, we would be very close to reaching the 30.00 level.

Cardano chart analysis
The price of Cardana is in a bearish trend from the 0.3801 level. This morning, the price fell to the 0.3037 level, thus forming this week’s lower low. Additional pressure is created by the image that the price has fallen below the EMA50 moving average. This could mean that the price continues to fall to lower support levels. Potential lower targets are 0.3000 and 0.2950 levels.
We need a positive consolidation and a retracement of the Cardan price above the 0.3150 level for a bullish option. Then, we would get support in the EMA50 moving average. Then, we need a new bullish impulse that will trigger further recovery. Potential higher targets are 0.3200 and 0.3250 levels.


