SafeMoon Bullish Move Testing EMA200: Here’s What To Expect
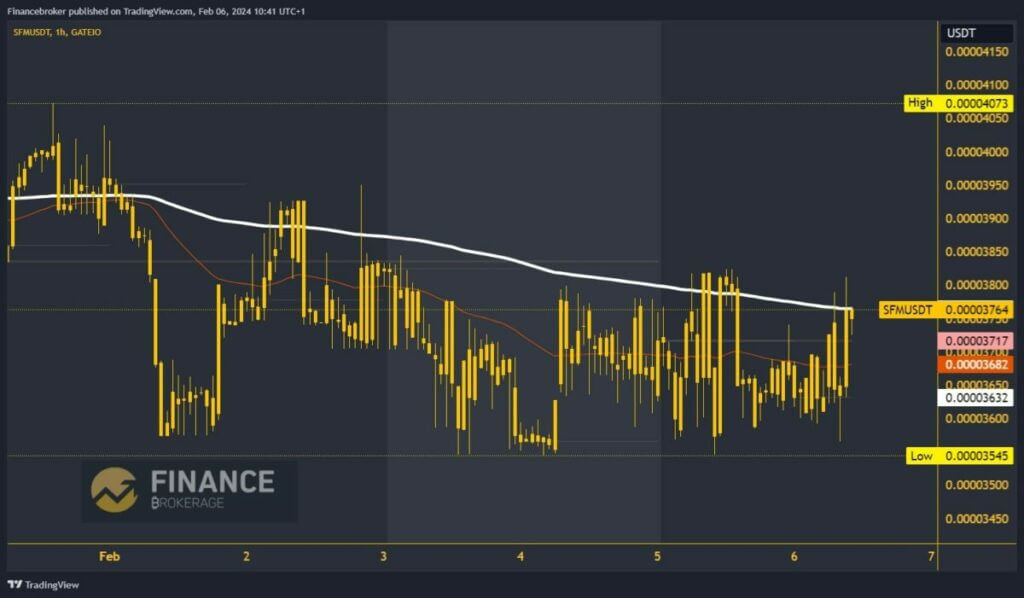
- The price of SafeMoon has been in the 0.00003550-0.00003800 range for the past four days.
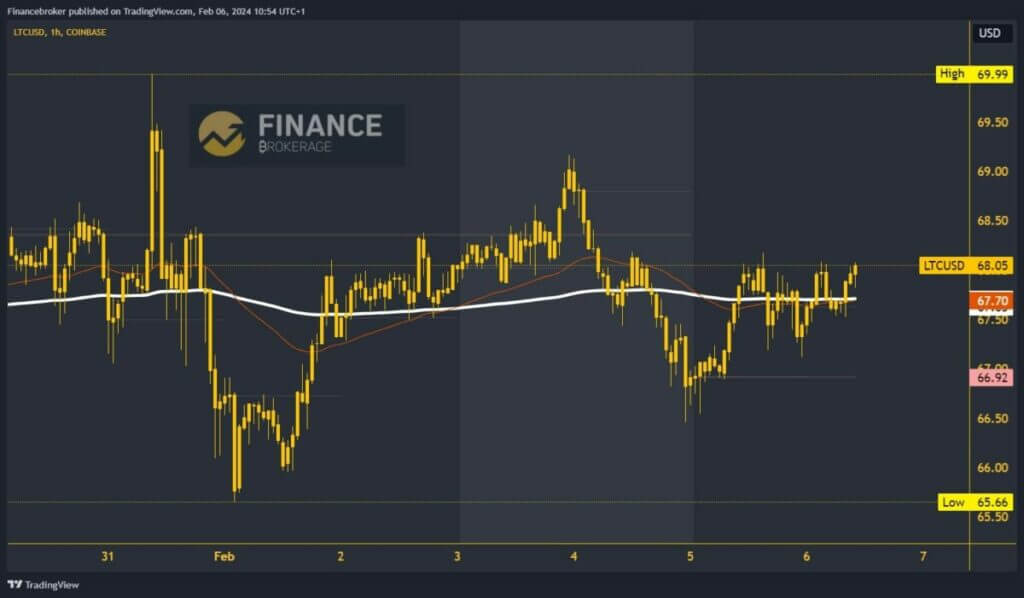
- On Saturday, we saw a bullish attempt by the price of Litecoin and the formation of a high at the $69.20 level.
SafeMoon chart analysis
The price of SafeMoon has been in the 0.00003550-0.00003800 range for the past four days. Today, we are looking at movement in the same range. The price is currently at the 0.00003750 level and is testing the EMA200 moving average. By moving above, we could get its support, which would mean when testing the 0.00003800 resistance level. If we succeed in that, we get the opportunity to go to the bullish side and climb to higher levels.
Potential higher targets are 0.00003850 and 0.00003900 levels. For a bearish option, we need to see a negative consolidation and a pullback to support at the 0.00003550 level. New price pressure in that zone could make a drop below with the formation of a new low. Potential lower targets are the 0.00003500 and 0.00003450 levels.

Litecoin chart analysis
On Saturday, we saw a bullish attempt by the price of Litecoin and the formation of a high at the $69.20 level. The price stops there and begins to pull back until Monday morning at $66.50. After receiving support, Litecoin starts a bullish consolidation and rises to the $68.00 level. By moving above $67.50, we got support in the EMA200, which means we can continue on the bullish side.
Potential higher targets are $68.50 and $69.00 levels. We need a negative consolidation and pullback to the previous support at the $67.00 level for a bearish option. New pressure could push the price even lower and send it to form a new weekly low. Potential lower targets are $66.50 and $66.00 levels.


