Oil seeks support at $86.00, Natural gas returns below $1.70
- On Friday evening, the price of oil rose to a new high this year at $87.59.
- Last week’s increase in the price of natural gas was stopped at the $1.80 level.
Oil chart analysis
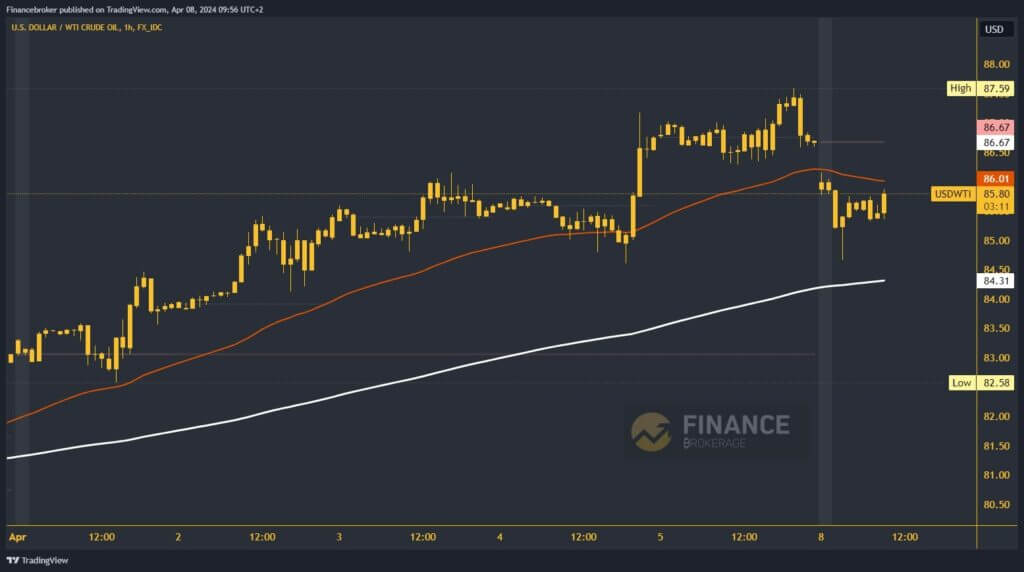
On Friday evening, the price of oil rose to a new high this year at $87.59. After that, until the end of the day, the price stabilized and closed at the $86.67 level. At the start of this week, we saw a bearish gap and a drop in oil price to the $84.66 level. After that, the oil price starts a bullish consolidation and returns above the $85.00 level. We are currently at $85.75 and expect to see the closing of this morning’s gap.
Potential higher targets are $86.50 and $87.00 levels. We could have a possible lower retracement at $86.00 in the EMA50 moving average. We need a positive consolidation and price pullback below the $85.00 level for a bearish option. Below that, we are back under bearish pressure and will have an opportunity to drop to a new daily low. Potential lower targets are $84.50 and $84.00 levels. Additional support in the zone around $84.50 is in the EMA200 moving average.

Natural gas chart analysis
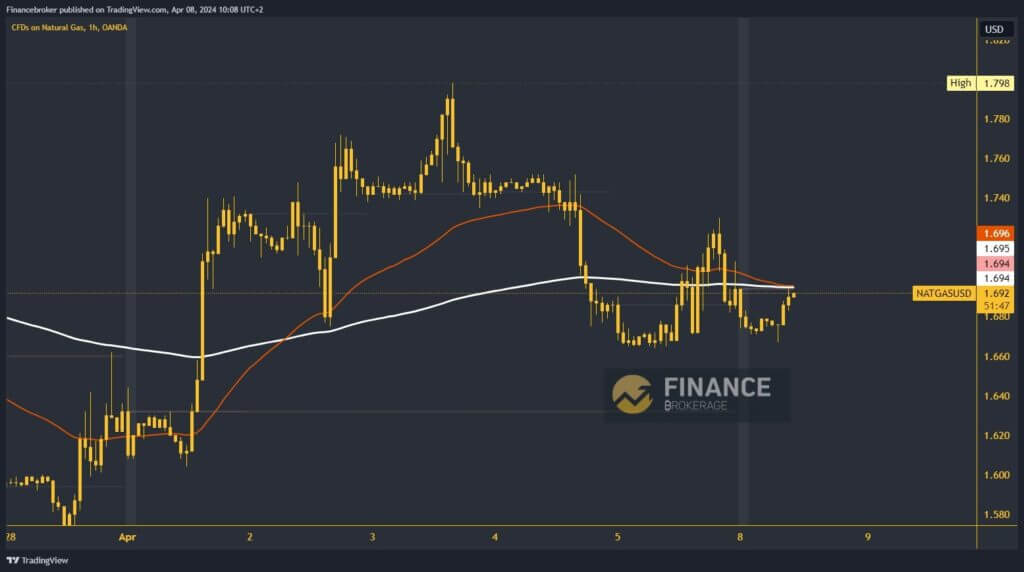
Last week’s increase in the price of natural gas was stopped at the $1.80 level. After forming that high, the price quickly pulled back to the $1.74 support level. On Thursday, we saw a drop below that support and a continuation on the bearish side all the way to the $1.66 level. On Friday, the price stabilized and returned above $1.70 and the EMA200 moving average. During this morning’s Asian session, the gas price was again under bearish pressure, testing the $1.66 level again.
The new support starts a positive consolidation taking us back to $1.69, within reach of the $1.70 level. We are a little short of moving above the EMA200, and with its support, we start a further recovery. Potential higher targets are $1.72 and $1.74 levels. We need a break below the $1.66 support level for a bearish option. Below that, we go to a new weekly low and turn to the bearish side.


