Oil and natural gas: the price of oil at the $71.00 level
- During the Asian trading session, the oil price returned to $70.50.
- On Friday, the price of natural gas rose above the $2.55 level.
Oil chart analysis
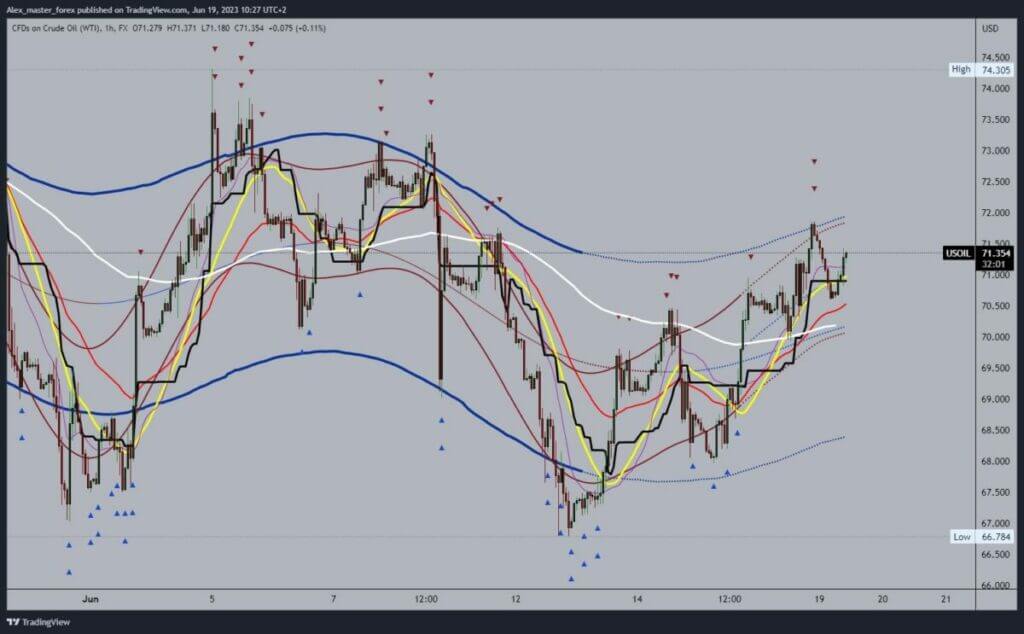
During the Asian trading session, the oil price returned to $70.50. After that, the price manages to consolidate there and starts a recovery above the $71.00 level. We are now at the $71.35 level and could soon see a break above the $71.50 level. In the continuation, the price could return to the $72.00 level and test last week’s high.
We would get a new opportunity to break above and form a new higher high. Potential higher targets are the $72.50 and $73.00 levels. We need a negative consolidation and a drop to the $70.00 level for a bearish option. Additional support at that level is the EMA50 moving average. A drop below could add pressure and push the price even lower. Potential lower targets are the $69.50 and $69.00 levels.

Natural gas chart analysis
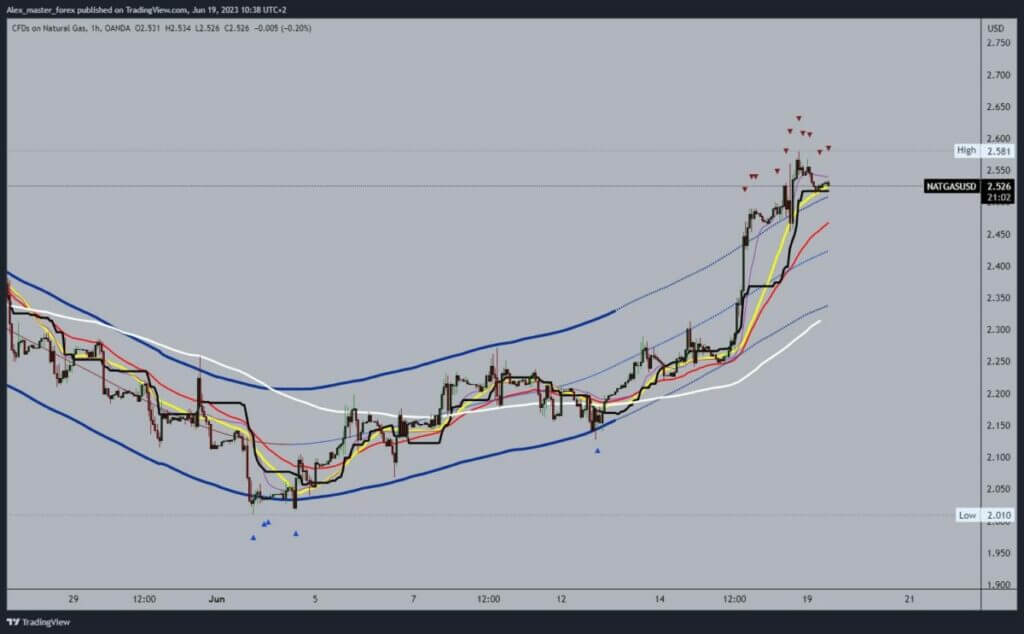
On Friday, the price of natural gas rose above the $2.55 level. A new June high was formed at the $2.58 level. During the Asian trading session, the gas price retreated to the $2.50 level. The price is still putting pressure on that level, and there could be a drop below it. After that, we would look at the $2.45 level as the next support zone.
If we don’t manage to hold on there either, the price could make a bigger retreat. Potential lower targets are the $2.40 and $2.35 levels. For a bullish option, we need a break above the $2.60 level, and the potential higher targets are the $2.65 and $2.70 levels.


