Oil and natural gas: Oil is looking for support at $78.00
- On Monday, we witnessed a pullback in oil prices to the $75.81 support level.
- This week could be a turning point for the price of natural gas.
Oil chart analysis
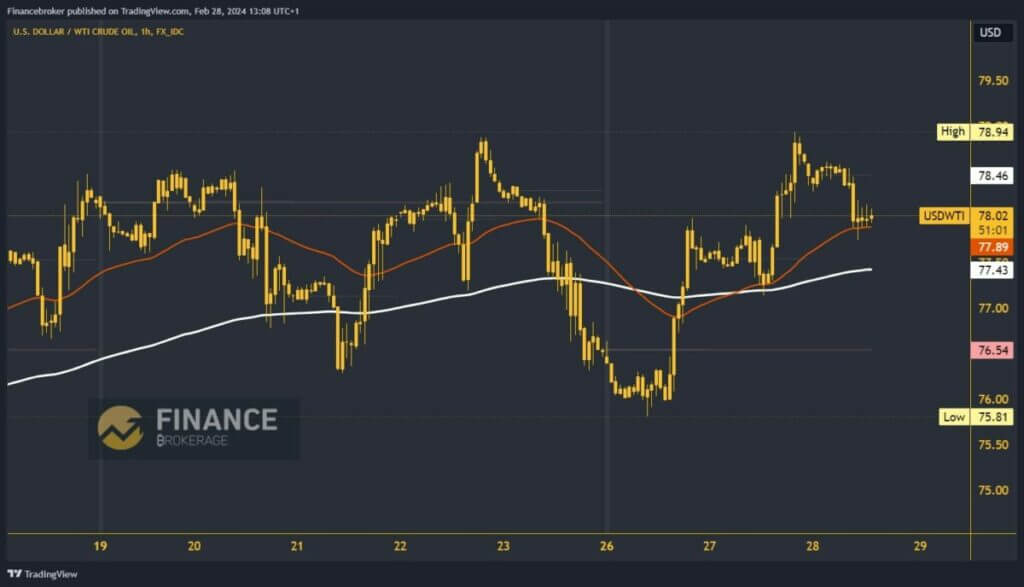
On Monday, we witnessed a pullback in oil prices to the $75.81 support level. In that zone, we managed to form a bottom and initiate a bullish consolidation, pushing up to the $78.00 level. We encountered resistance at that level yesterday and experienced a retreat to the $77.15 level. At that point, we encountered the EMA200, and with its support, we initiated a new bullish consolidation all the way up to $78.94, where we formed a new weekly high.
During the previous Asian trading session, oil retreated against a strong dollar, dropping from $77.75. For now, we’re holding slightly below $78.00 and awaiting news on the US GDP at the beginning of the US session. We need an impulse above $78.50 to return and climb above the Asian high price. Then, we should sustain ourselves up there if we plan to test the weekly high and continue rising. Potential higher targets are the $79.00 and $79.50 levels.

Natural Gas chart analysis
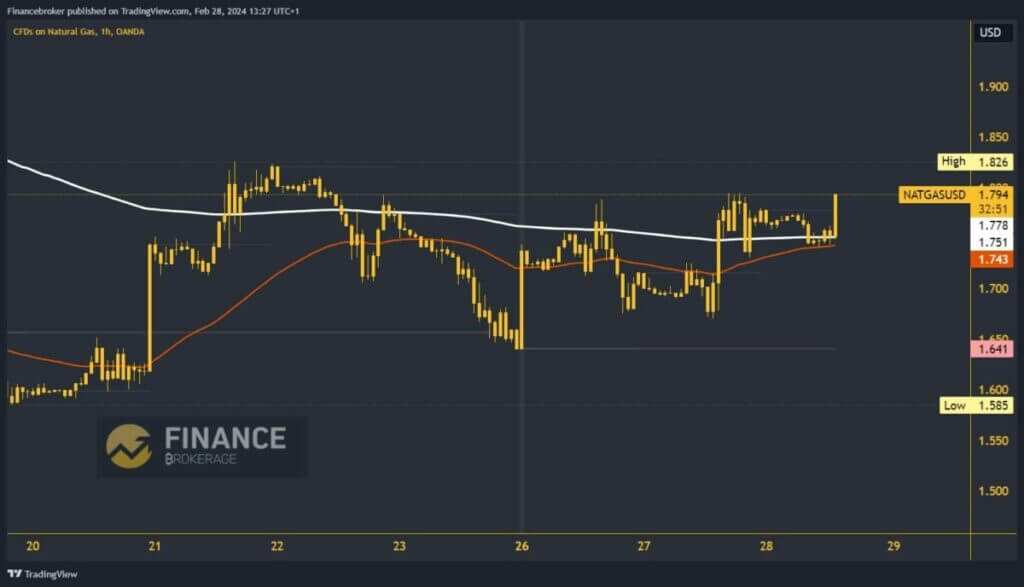
This week could be a turning point for the price of natural gas. Right at the market opening on Monday, we saw a bullish gap from $1.64 to $1.74. Subsequently, the price managed to hold in that zone and formed a daily high at the $1.78 level. We encountered resistance in that zone and retreated below the $1.75 and EMA200 moving averages. The price turned bearish again but successfully halted at the support at the $1.67 level.
On Tuesday, we found new support in that zone, producing a bullish impulse and a return above the EMA200 and the $1.75 level. With these steps, we reached a new weekly high at the $1.79 level, approaching the $1.80 level. During this morning’s Asian session, the price of natural gas retreated from $1.78 to the $1.74 support level. Now, we’re in a bullish consolidation and expect to see a new bullish impulse with the support of the EMA200, surpassing the $1.80 resistance level. Potential higher targets are the $1.82 and $1.84 levels.


