Oil and natural gas: Oil is approaching the $69.00 level
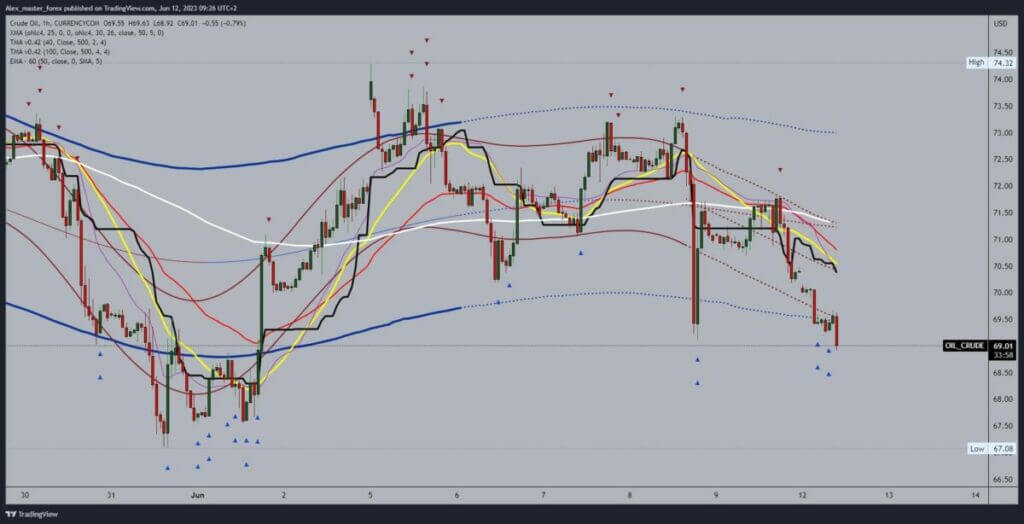
- During the Asian trading session, oil price continue to slide below the $70.00 level.
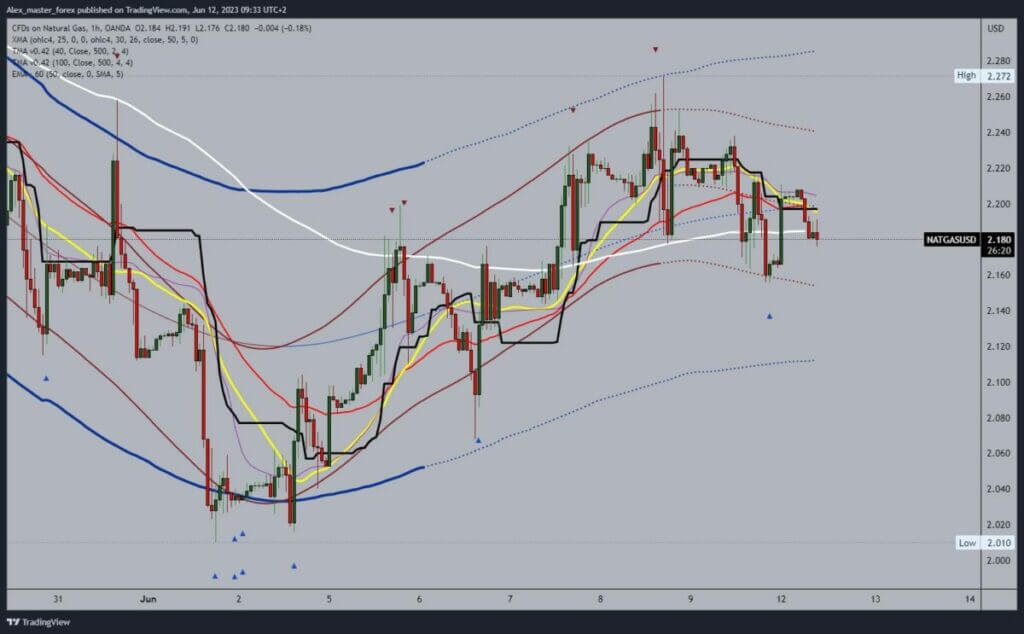
- During the Asian trading session, the price of natural gas retreated from the $2.20 level.
Oil chart analysis
During the Asian trading session, oil price continue to slide below the $70.00 level. The pressure on the price pushes it to the $69.50 level, but oil does not get support there either and breaks below. We are now at the $69.20 level, and if this consolidation continues, we could expect a drop below the $69.00 support level.
Potential lower targets are the $68.00 and $67.00 levels. The $67.08 level is our June low, and we may find support at the same level. We need a positive consolidation and a return above the $70.00 level for a bullish option. Then we need to hold on up there in order to form a new two, from which we would start to continue the recovery. Potential higher targets are the $71.00 and $72.00 levels.

Natural gas chart analysis
During the Asian trading session, the price of natural gas retreated from the $2.20 level. We are now at the $2.18 level and are testing the EMA50 moving average in the hope of getting its support. If we fail to do so, the price will continue to pull back and form a new low. Potential lower targets are the previous low at $2.16, then the $2.14 level.
If we break below the $2.14 level, the place of the previous consolidation, the price could easily slip to the $2.10 level. We need a positive consolidation and a return above the $2.20 level for a bullish option. Then we need to stay up there before continuing the recovery. Potential higher targets are the $2.22 and $2.24 levels.


