Oil and natural gas: Oil hits new high at $95.00 level
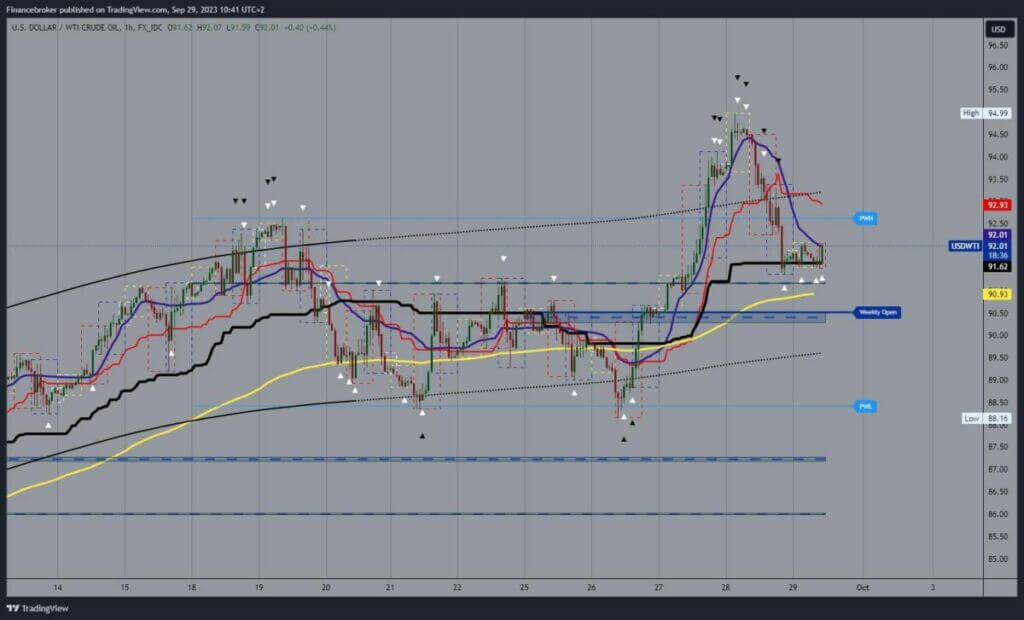
- The oil price climbed to a new one-year high yesterday at $95,00.
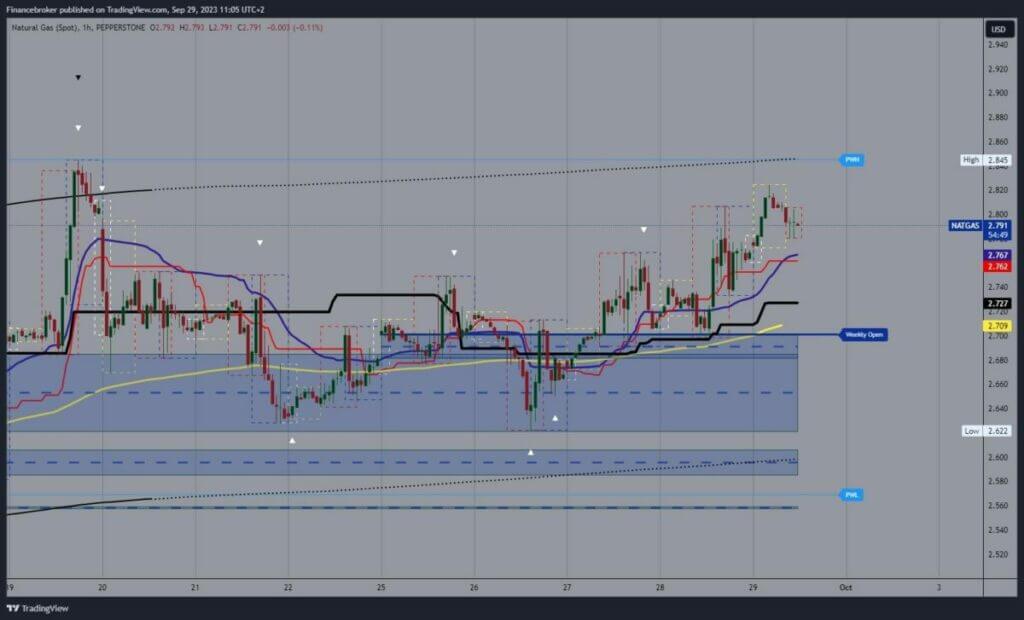
- The price of natural gas was in a bullish trend this week from $2.62 to $2.82 level.
Oil chart analysis
The oil price climbed to a new one-year high yesterday at $95,00. At that level, we encounter resistance, and the price begins to retreat. The decline was stopped at the $91.40 level, and we have been holding above that level since then. During the Asian trading session, the price tried to climb above the $92.00 level, but it ended without success. We remain in the support zone, and the price is still under pressure to break below and continue the pullback. Potential lower targets are $90.50 and $90.00 levels.
We need a positive consolidation and price movement to the $92.50 level for a bullish option. Then, we need to hold up there in order to initiate a continuation to the bullish side from there. Potential higher targets are $93.00 and $94.00 levels.

Natural gas chart analysis
The price of natural gas was in a bullish trend this week from $2.62 to $2.82 level. During the Asian trading session, a new high was formed at the $2.82 level. There, we encounter resistance and see a pullback to the $2.78 level. Here, we have temporarily stopped the price pullback and could form a new bottom from which we would start a bullish consolidation. Potential higher targets are $2.84 and $2.86 levels.
We need a negative consolidation and price pullback to the $2.75 level for a bearish option. A break below would drop us to a test of previous support levels. Potential lower targets are $2.74 and $2.72 levels. Additional price support is in the EMA50 moving average in the zone around the $2.70 level.


