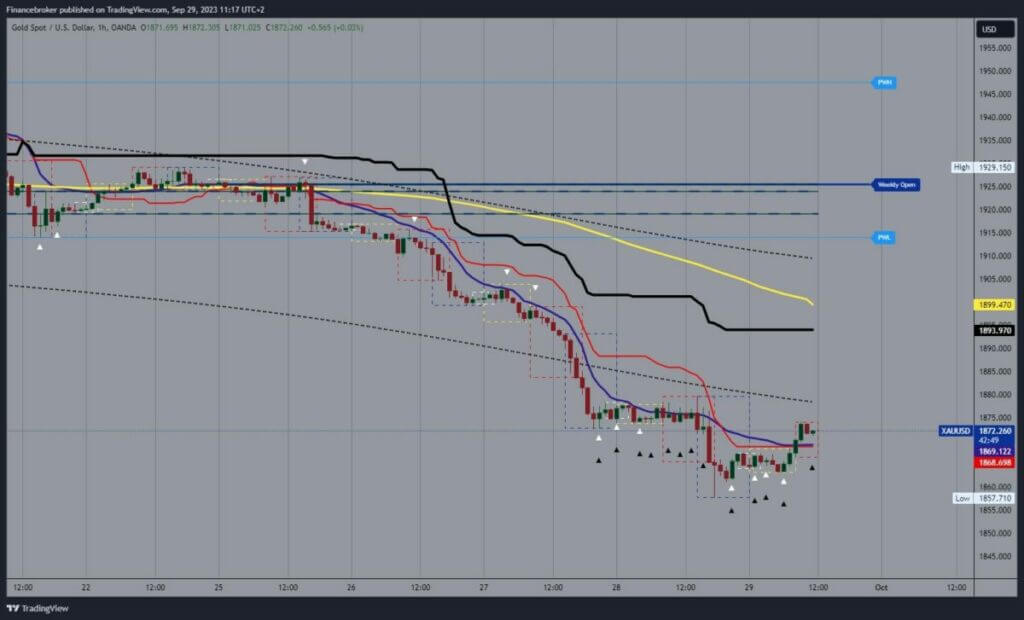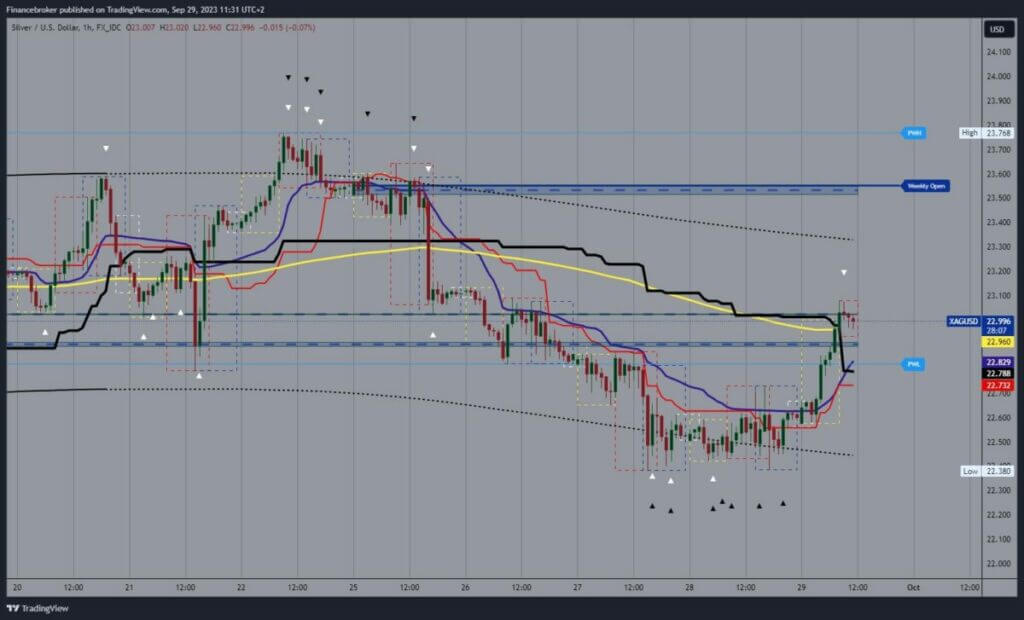
Gold and silver: Gold fell below the $1860 level yesterday
- Yesterday, the price of gold fell to a new six-month low at $1,857.
- Yesterday, we saw a pullback in the price of silver to the $22.38 level.
Gold chart analysis
Yesterday, the price of gold fell to a new six-month low at $1,857. During the Asian session, the price managed to consolidate and start a recovery. We are currently at the $1872 level and could expect to see continued growth above the $1880 level. If we were to succeed in our intention to break above $1880, we would have the opportunity to continue on the bullish side.
Potential higher targets are $1885-$1890 levels. We need a negative consolidation and a new pullback to the $1860 support level for a bearish option. A break below could lead to the formation of a new low and thus confirm a bearish option. Potential lower targets are $1855 and $1850 levels.

Silver chart analysis
Yesterday, we saw a pullback in the price of silver to the $22.38 level. After that, we managed to get support in that zone and start a bullish consolidation. During the Asian trading session, we saw a strong bullish impulse pushing the price towards $23.00. For now, we have resistance in that zone and are consolidating around that level. The EMA50 moving average provides additional support, and based on that, we could expect to continue the recovery. Potential higher targets are $23.20 and $23.40 levels.
We need a negative consolidation and pullback to the $22.50 level for a bearish option. We are very close to testing the previous low at $22.38. A break below and the formation of a new low would mean that we continue further to the bearish side. Potential lower targets are $22.30 and $22.20 levels.


