


New pullbacks for Bitcoin and Ethereum prices
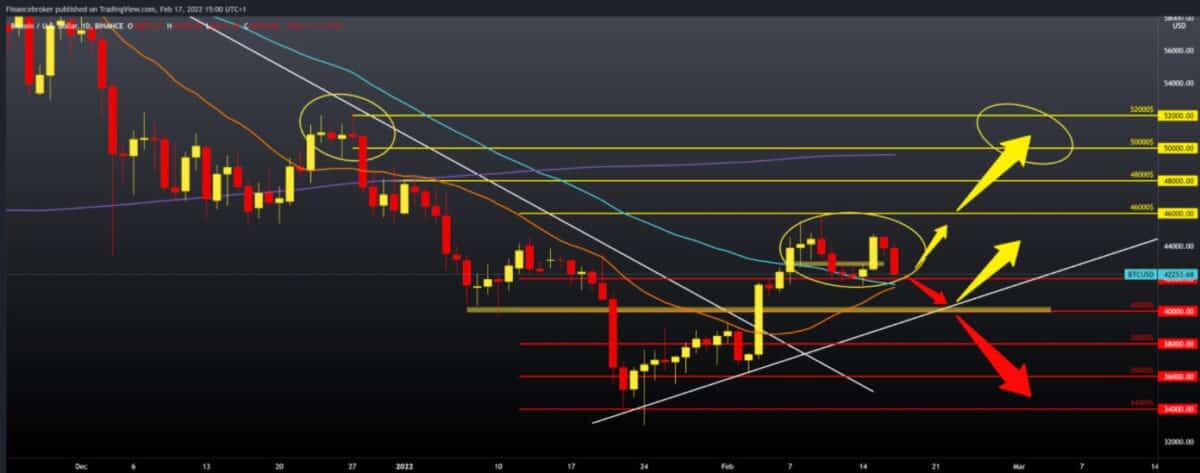
Bitcoin chart analysis
The price of Bitcoin continues to trade above the MA20 and MA50 moving averages. This is a possible indicator of a shift to previous highs. For the last ten days, Bitcoin has been trading in a narrow range between $ 41,600 and $ 45,500. The Bulls failed to break the prevailing $ 45,000 resistance three times. Bitcoin will recover to the psychological level of $ 50,000 if the bulls overcome the resistance of $ 45,000. The later potential may help the bull’s momentum climb to a maximum of $ 52,000. However, if the bears manage to lower the price of Bitcoin below support to $ 41,800, the declining trend is very likely to continue. Bitcoin will continue to rise as long as the price remains above moving averages. The practice is that consolidation below the resistance level after a certain period of time increases the probability of breaking above.
Bullish scenario:
- We need new positive consolidation and support for MA20 and MA50 above $ 42,000 if we are to remain optimistic about the potential continuation of the bullish trend.
- We need to climb again to the previous resistance at $ 45,000, and we need a break above to continue.
- Our next resistance is at $ 46,000, support from the beginning of the year that didn’t last.
- It would be important for us to climb to $ 50,000 and the MA200 moving average, and a break above would increase bullish optimism in further price recovery.
- After that, we enter the essential zone between $ 50,000 and $ 52,000. The price of $ 52,000 is high in December.
Bearish scenario:
- We need to continue this current minor negative consolidation and pull the price below $ 42,000 and the MA20 and MA50 moving averages.
- A break below would lower us to the $ 40,000 support zone and lower trend support line.
- Increased bearish pressure could continue to lower the price to $ 38,000 in support, then $ 36,000.
- The maximum pullback price on this chart is our $ 34,000 zone, the January support zone.

Ethereum chart analysis
Ethereum’s price this month fails to make a stronger move above $ 3,200 and break the bearish trend. We seem to be back to previous support in the zone around $ 2,800 and the MA200 moving average. The MA20 and MA50 are slowly moving to the bearish side following the current price movement.
Bullish scenario:
- We need a new positive consolidation and a break above the previous resistance at $ 3,200.
- After that, we are back above the MA20 and MA50 moving averages, and we expect their support to continue the bullish trend.
- Our next first resistance is the $ 3400 high from January if the price breaks above.
- Then, following the $ 3600 low from December. And next is the $ 3800 level January high.
Bearish scenario:
- We need the continuation of the current negative consolidation and the withdrawal of the price below $ 3,000 to the $ 2,800 support zone.
- If it doesn’t hold up, the price will continue to fall until the next first support at $ 2,600.
- Our following support zones are $ 2,400, and the January minimum is $ 2,200.

-
Support
-
Platform
-
Spread
-
Trading Instrument

