Litecoin analysis for April 27, 2021
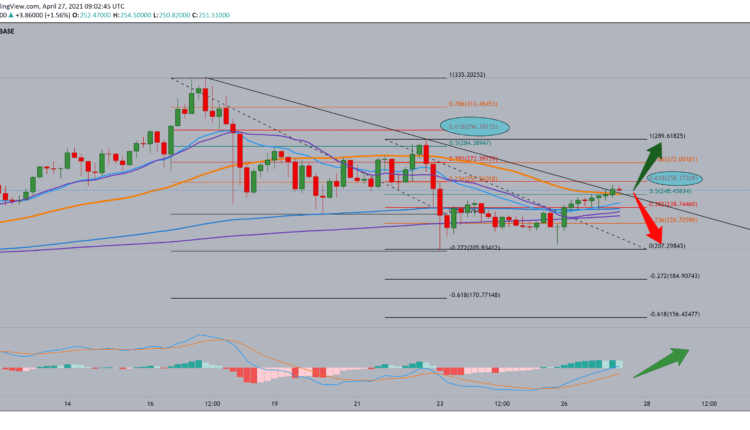
Looking at the chart on the four-hour timeframe, we see that Litecoin, after finding support at $ 207.10, is moving again in winning new highs on the chart. The trend is bearish from the previous high at $ 335.35. The first pullback was up to 50.0% Fibonacci level, then a drop again, then a new pullback, but now we are close to 61.8% Fibonacci level at $ 258.17.
Moving averages are on a bullish stand and provide Litecoin support for the potential continuation of the growing trend. From the top, we can draw a trend line, merging the previous highs. Currently, Litecoin is testing that resistance along with a $ 61.8 Fibonacci level, and there we can expect stronger resistance. If we see a break above that Fibonacci level, our first next target is our previous high at $ 289.60.

So now we can first expect a shorter consolidation before the next stronger momentum. The distribution of Litecoin’s offerings shows that investors holding between 10,000 and 100,000 LTCs increased from 421 to 435. This 3.3% increase indicates that these market participants are optimistic about the bullish outlook on the price of Litecoin.
Regardless of the bull’s outlook from several perspectives, if the price of Litecoin does not remain above $ 218, it will disable the upward trajectory shown so far. In these circumstances, the LTC could slip to the bottom line of the demand zone trend at $ 211 or $ 204, as the fall momentum of the fall testified on April 23.
-
Support
-
Platform
-
Spread
-
Trading Instrument


