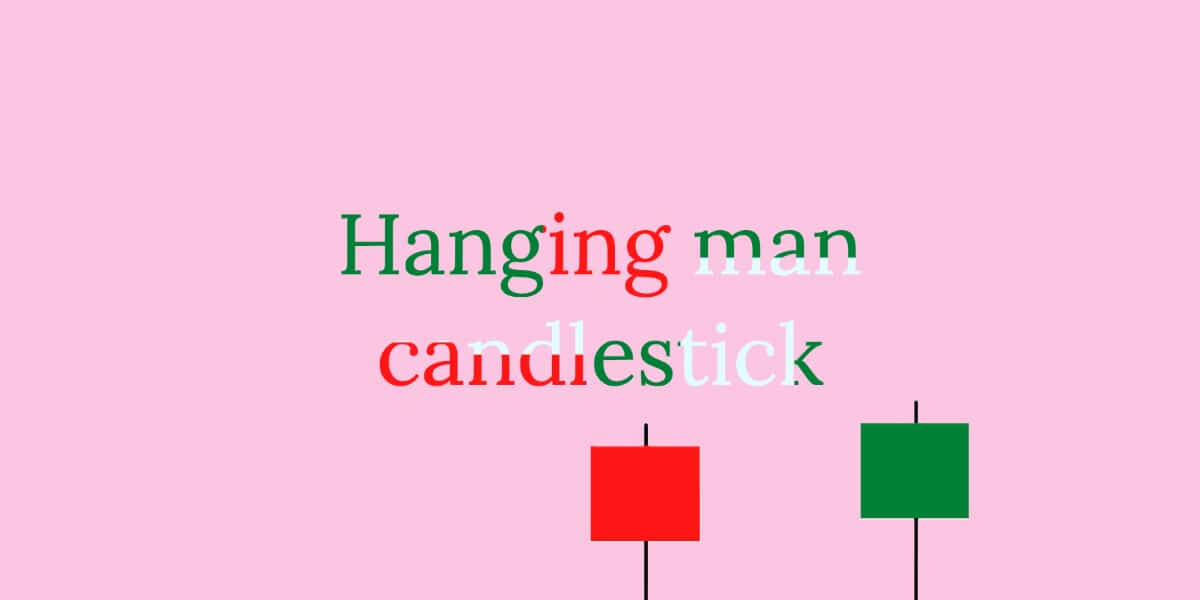
Hanging man candlestick – what does it mean?
Chart representations of asset prices can have quite peculiar names. The hanging man candlestick is certainly one of the oddest names for graphic representation in tech analysis. We are going to show you what this candlestick represents, how to spot it in the graph and how to interpret this pattern correctly. Also, we will compare the hanging man candlestick with other similar patterns, such as the hammer candlestick and morning start. Keep reading to find out more.
Hanging man candlestick – key takeaways
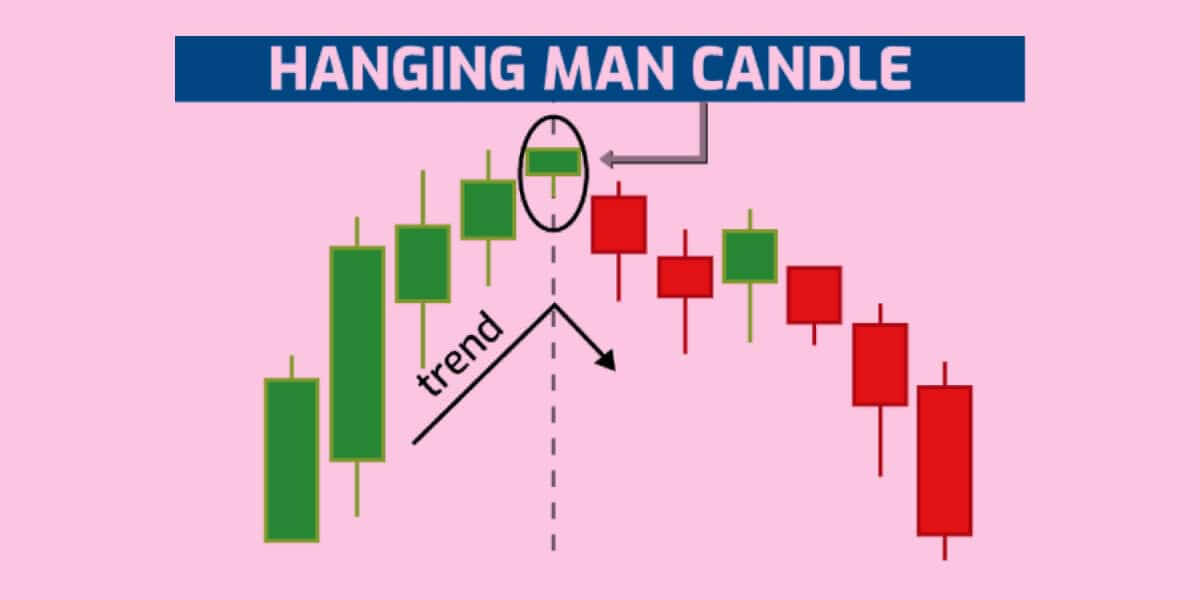
The hanging man candlestick is the first bearish alert in an uptrend and will, in most cases, lead to bearish consolidation. The most difficult thing is that it is complicated to know, with only these indications, the strength and duration of this drop.
The hanging man located after a continuation of rise will indicate the possibility of a fall because it is a signal of the end of a bullish trend.
The shape of this candle, with a large low wick, shows us that the buyers have lost control for a while, the buyers have reappeared to go up in price before the end of the candle, but it is too late, and the bullish momentum is halted.
What is a hanging man candlestick?

So, what does hanging man candlestick mean? The hanging man is often the harbinger of a downturn. Graphically, it looks like a hammer. Except that, unlike, you find it at a market top or a major resistance. Due to the market situation, do not attach too much importance to its color.
How should it be interpreted? Investors are expressing doubts about the continued rise in the share price. After a new high, they feel there is no reason to buy and look for excuses to drop. Taking profits does not hurt.
If you are looking for confirmation of the hanging man, you must wait for one or two bearish sessions to act calmly. In practice, it would be more reliable if it appeared on a major resistance level.
Graphic representation of Hanging man candlestick
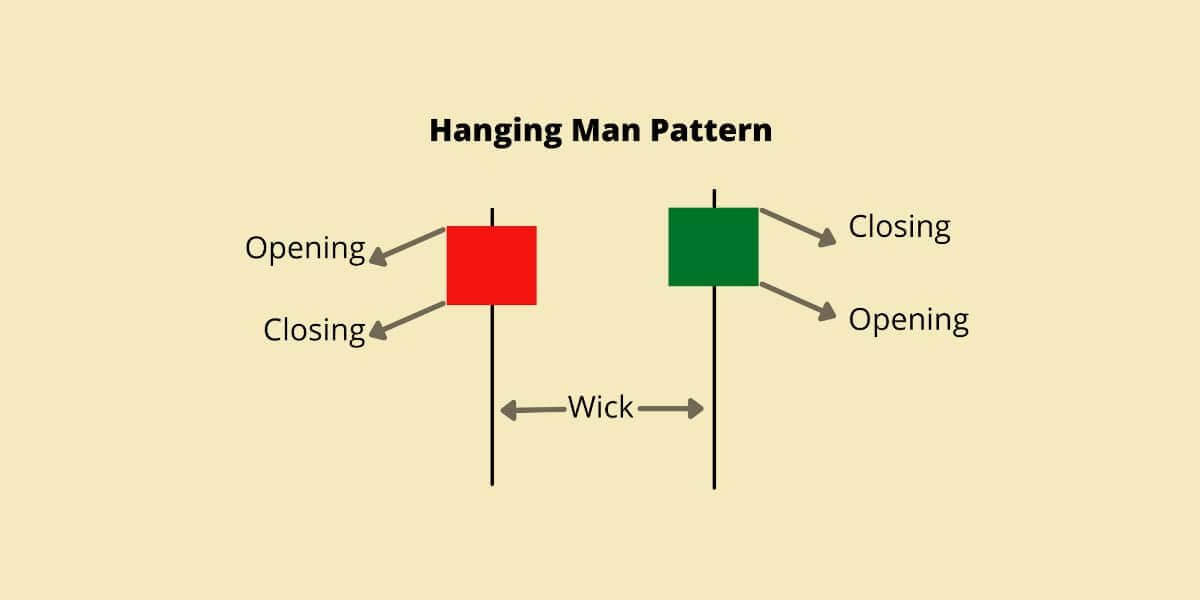
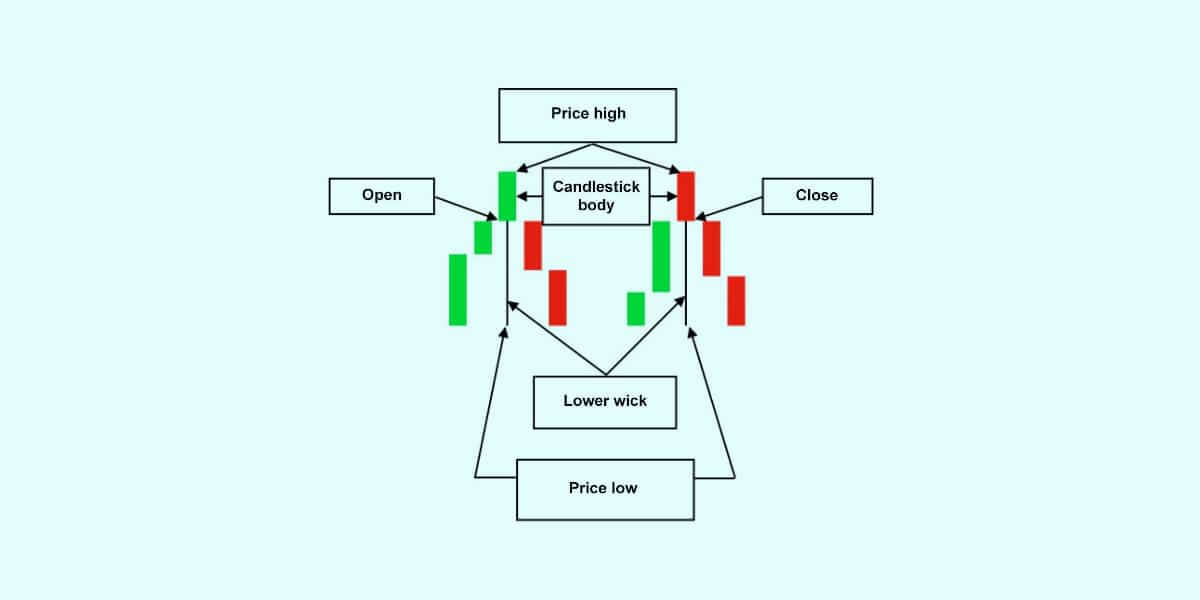
The hanging man is also known as a spinning top. These are candlesticks with small real bodies. The low height of the body, which should not be zero, indicates that the closing price is relatively close to the opening price. The long lower shadow marks the importance of the variations of the session.
The candlestick should not normally have an upper shadow. The presence of a wick on the top of the candlestick is tolerated as long as the size of this one remains short and does not exceed the height of the body of the candle.
Keep in mind that the size of a candlestick is relative, and should be interpreted in relation to previous candles.
The main characteristics of the hanging man candle – hanging man candlestick patterns
- The hanging man is a candlestick with a small body close to the highest and of a long low shadow.
- Its presence in an uptrend signifies the presence of a top and, therefore, the end of the uptrend.
- Body colour is not important. On the other hand, the lower shadow must represent at least twice the length of the candlestick body.
- The longer, the lower shadow and the shorter the upper shadow, the more this figure is a harbinger of a bearish reversal pattern.
The hanging man candlestick explained

The hanging man is a Japanese candlestick consisting of a small body as well as a long lower wick. The small body indicates some form of hesitation on the part of buyers. The long wick under the candlestick specifies that the sellers are present.
Consider the hanging man an alert, not a trend reversal sign. The following candles will clarify the upward or downward direction of the value of the action.
The Hanging Man is a Japanese candlestick whose morphology is identical to the hammer’s. It consists of a small body extended by a long low wick.
A high shadow can be tolerated, but it should be as short as possible and not exceed the height of the candle’s body.
Unlike the hammer, the Hanging Man is a candle mainly found on top of an uptrend.
We say primarily because a hanging man can also appear on a temporary rise during a downtrend. It can, in this case, be considered as a figure of the resumption of the downtrend.
The brief rise, also called rebound, may be due to positions liquidated by certain participants.
Whatever the graphic configuration, the hanging man must, in any case, be preceded by several bullish candlesticks.
Hanging Man vs Shooting Stars and Hammers
When the candlestick appears at the bottom of a downtrend, it is called the “Hammer”. It is a signal of a reversal of the upward trend. This type of candlestick is called a “hanging” when it appears at the top of an uptrend. This is a downtrend reversal signal.
The principle of the hammer is that after a new low highlighted by the bearish wick of the hammer, a reversal occurs, and the buying pressures allow the price to rise and the formation of the small body.
The presence of large volumes increases the probability of an upward reversal.
The principle of the hanging man is that after a new high, the selling pressures become very strong and allow the bearish wick of the hanging man to form.
The trend reversal becomes effective in the event of the appearance of a bearish candlestick during the following time frames.
The shooting star is a structure formed from a single Japanese candlestick. It’s a bearish candle with a small body and a large high wick whose size must be at least twice the body. The closing price of the next candlestick must be below the low point of the shooting star.
The shooting star often forms after a significant rise characterized by several large green Japanese candlesticks.
If the pattern forms after a downtrend, it is called an inverted hammer.
The shooting star is a reversal pattern. It indicates a downward trend reversal. It reflects an overbought market where sellers end up taking over at the end of the period.
How to interpret a hanging man candlestick?

After several consecutive bull sessions, the sellers (bears) begin to put pressure on the buyers (bulls) and manage to lower the value of the security significantly during the session. This graphically translates into a long wick under the candlestick.
Some investors are convinced that the security price has peaked and have begun liquidating their positions. These investors are the sellers (bears).
Despite everything, buyers (bulls) manage to take back what was sold to sellers (bears) and then maintain a price relatively close to the opening value until the close. This is the reason why the candlestick has a small body.
The larger, the lower wick, the more it denotes significant fluctuations during the session. The battle between the sellers (bears) and the buyers (bulls) was important and shows that the sellers (bears) are indeed present and could reverse the trend during the following sessions.
How to use hanging man formation for trading?
So how does trading the hanging man work?
The Japanese hanging man candlestick is a sign that some investors view the stock’s value as having peaked. They will therefore begin to sell their positions, which will cause the stock price to fall.
Think of a hanging man as just an alert. A message that shows that a potential reversal of the downtrend is possible. This Japanese candlestick is a sign that the sellers (bears) could gradually take over the buyers (bulls) and extend the decline in the coming sessions. Therefore the hanging man should not be a signal to take a stand. The decline must, above all, be confirmed.
Upon seeing such a pattern, consider initiating a short trade near the close of the down day following the hanging man.
Candles that form after a Hanging Man should close below the hanging man’s highest point. This will confirm the presence of the sellers. However, it is not guaranteed that the price of a security will fall after a hanging man pattern, including when the pattern has been confirmed by a second bearish candlestick pattern.
When a hanging man occurs in an uptrend, it is best for the candle to be bearish. That is to say, with an opening price higher than the closing price. Otherwise, this implies that the sellers (bears) are not influential enough and that the buyers (bulls), even if they weaken, remain present.
Bottom line – The meaning of the hanging man candlestick pattern
You can find hanging man patterns very frequently in the technical analysis charts. However, when you highlight them, you will see that most are poor predictors of a price move lower. Think of a hanging man as just an alert. A message that shows that a potential reversal of the downtrend is possible. If you search for the increased volume, a sell-off the next day, this pattern turns out more reliable. Use a stop loss above the hanging man high to trade it.


