Gold and Silver: Two-year Low VS Three-week Lower Low
- The price of gold fell to a new two-year low at the $1,620 level late last night.
- During the Asian trading session, the price of silver formed its three-week lower low at the $18.35 level.
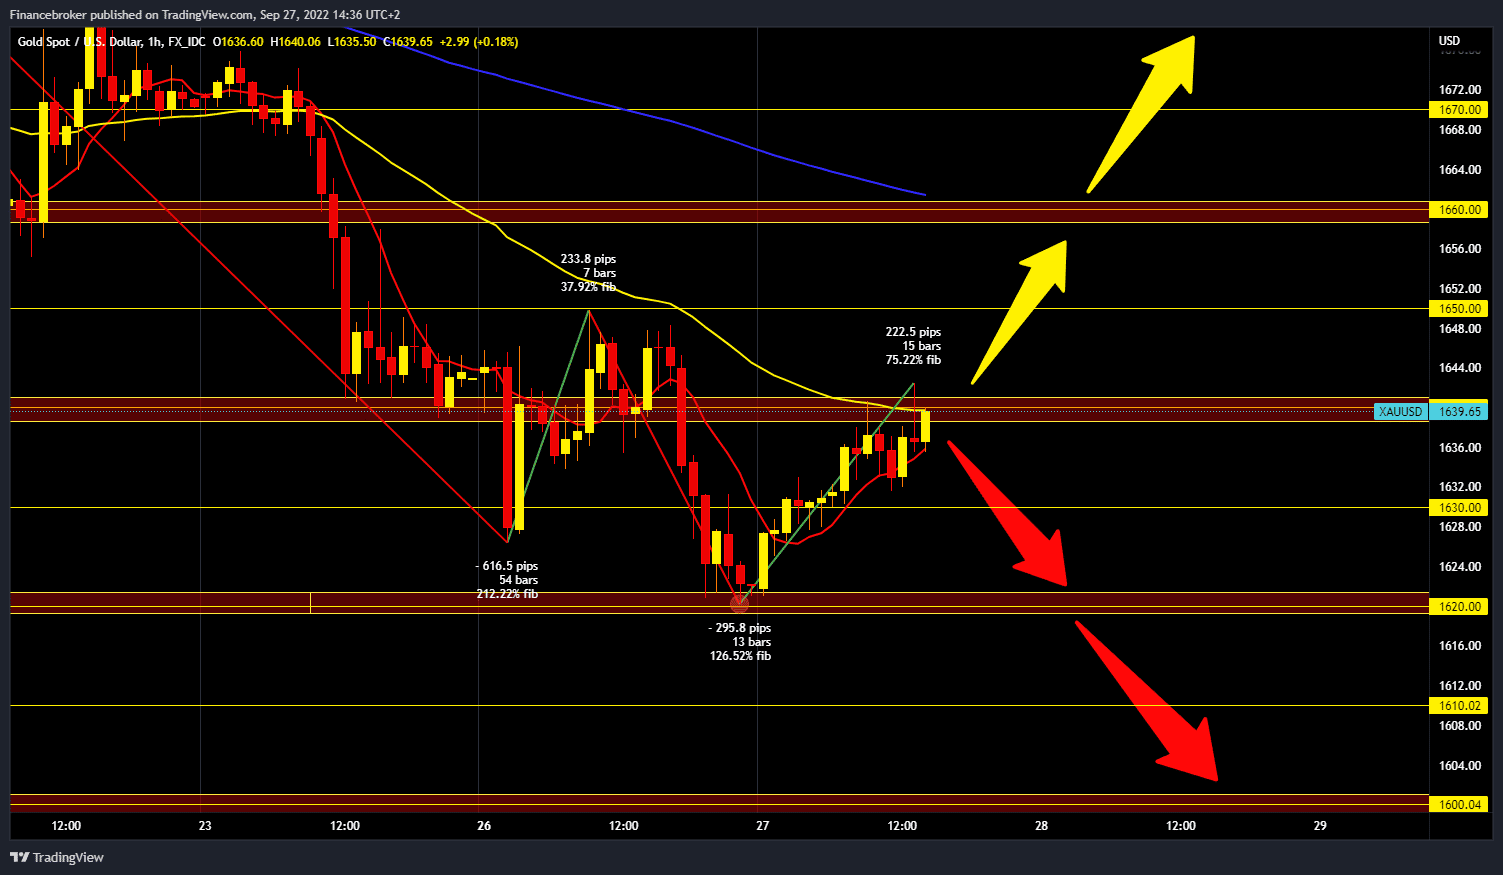
Gold chart analysis
The price of gold fell to a new two-year low at the $1,620 level late last night. Gold began to recover during the Asian trading session, and we are now at the $1640 level. If we were to rise to $1660, we would form a new higher high and thus confirm a potential recovery. Additional resistance at that level is in the MA200 moving average. It is also vital for us to stay around $1650 for a while and form a new bottom there in order to strengthen the support. For a bearish option, we need a new negative consolidation. Then the price would turn towards lower support levels. We would probably retest the previous low at the $1620 level. Potential lower targets are $1610 and $1600 levels.
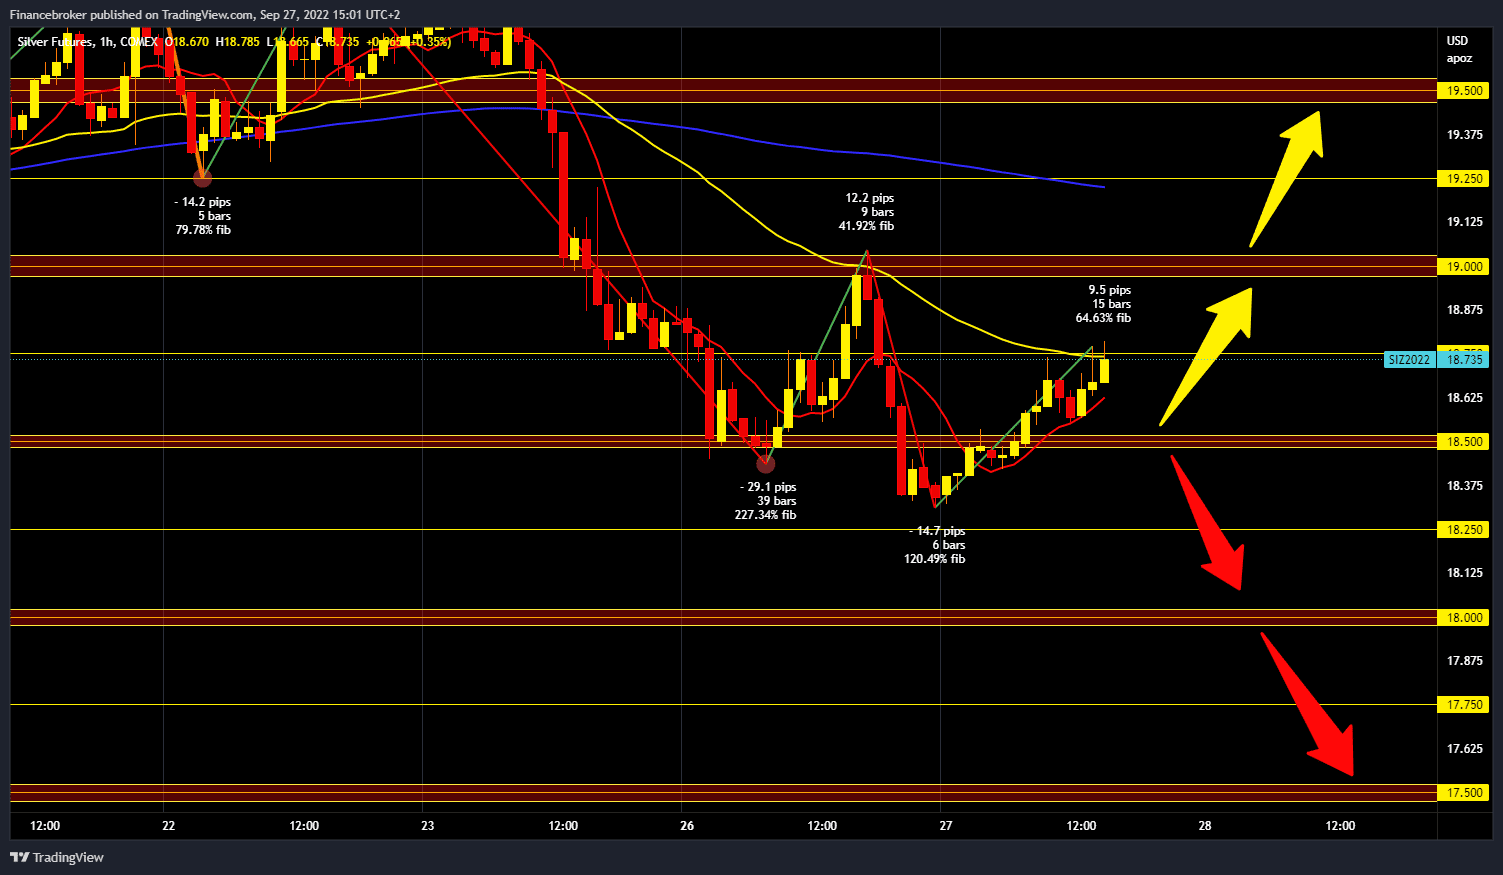
Silver chart analysis
During the Asian trading session, the price of silver formed its three-week lower low at the $18.35 level. Then we managed to stabilize at that level and, with a new bullish impulse, move up to the $18.75 level. The potential resistance at that level is in the MA50 moving average, and we need a break above it to continue the recovery. Our next target is yesterday’s high at the $19.00 level. If we managed to move above it, we would form a new higher high, and the target is at the $19.25 level. Additional resistance in that zone is the MA200 moving average. We need a new negative and a price drop below the $18.50 level for a bearish option. After that, we could once again test the $18.35 this morning low. Potential lower targets are $18.25 and $18.50 levels.