Gold and silver: The price of gold on the way to $2050
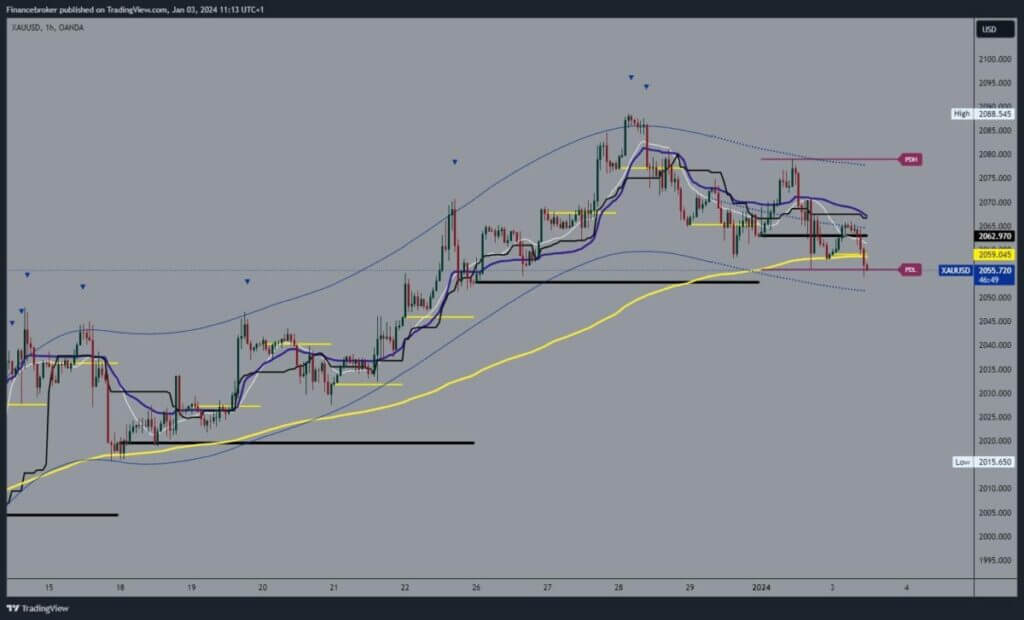
- The price of gold jumped yesterday to the $2078 level, where we formed a new three-day high.
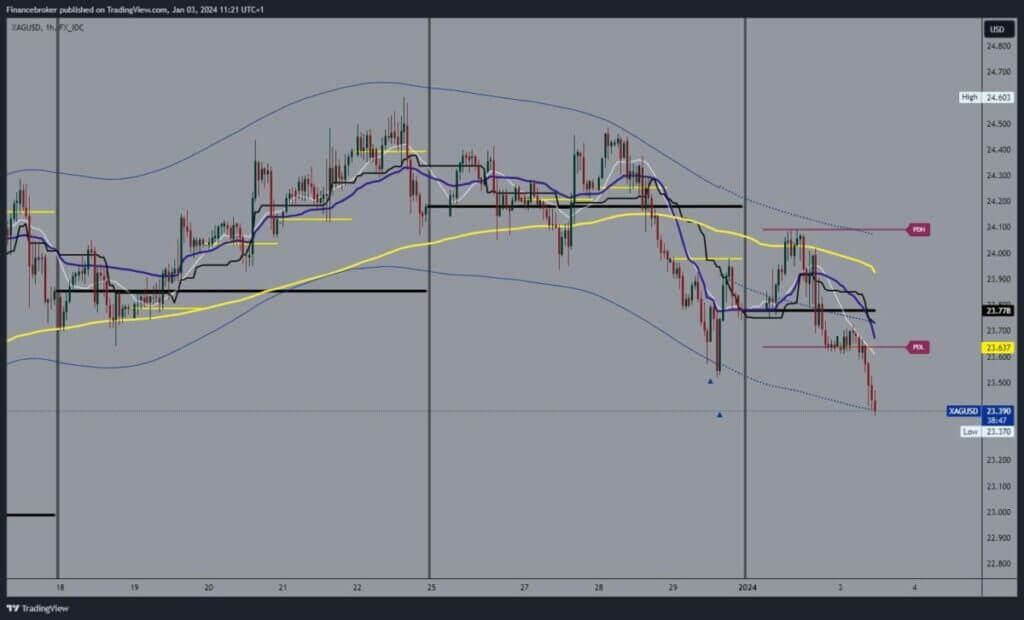
- Yesterday, we saw the price of silver bounce off the EMA50 moving average at the $24.00 level.
Gold chart analysis
The price of gold jumped yesterday to the $2078 level, where we formed a new three-day high. There, we encountered strong resistance and began a retreat that continues today. This morning, we fell to the $2054 level and dropped below the EMA50 moving average. Such movement leads to increased pressure on the price of gold and could send it to even lower levels. Potential lower targets are $2050 and $2045 levels.
We need a positive consolidation and a return above the $2060 level for a bullish option. So we would go back above the EMA50, and we could get its support. We must then move above $2065 for a break above today’s resistance zone. Potential higher targets are $2070 and $2075 levels.

Silver chart analysis
Yesterday, we saw the price of silver bounce off the EMA50 moving average at the $24.00 level. The price drops below and begins a bearish consolidation that has continued today. During the Asian trading session, the price was maintained at around $23.60, and then we saw a breakout below and the formation of a new low at the $23.40 level. After forming a new lower low, we get confirmation of bearish momentum and expect to start a further pullback.
Potential lower targets are $23.30 and $23.20 levels. A positive consolidation and price return above the $23.70 level is required for a bullish option. Then, we should hold up there and wait for a new impulse to continue to the bullish side. Potential higher targets are $23.80 and $23.90 levels. Additional resistance in the EMA50 moving average is now at $23.90.


