Gold and Silver: The Price of Gold Fell to the $1631 level
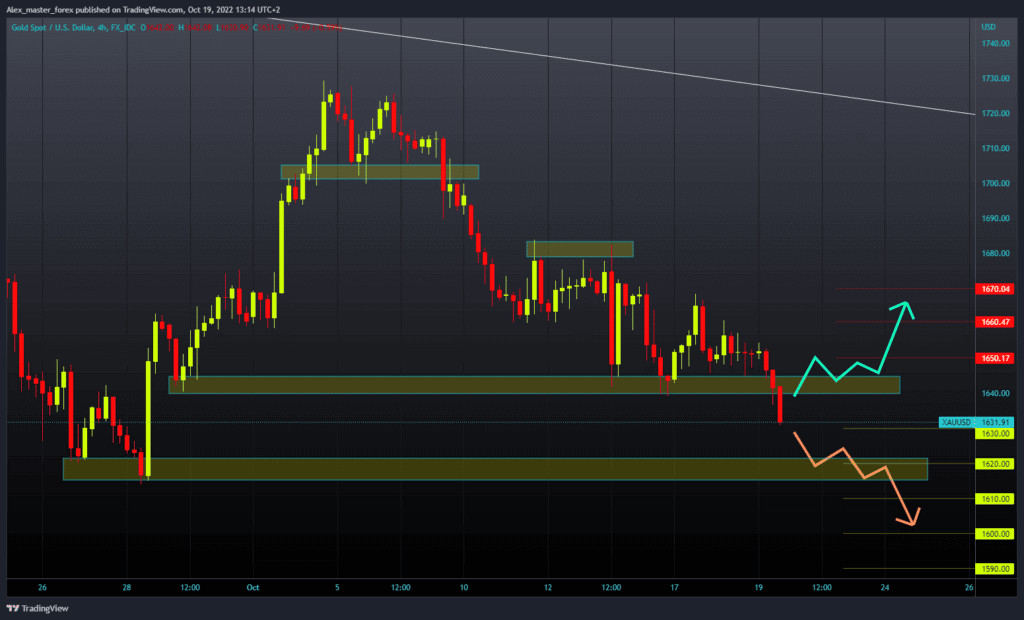
- Today, the price of gold broke through the October support zone and fell to the $1631 level.
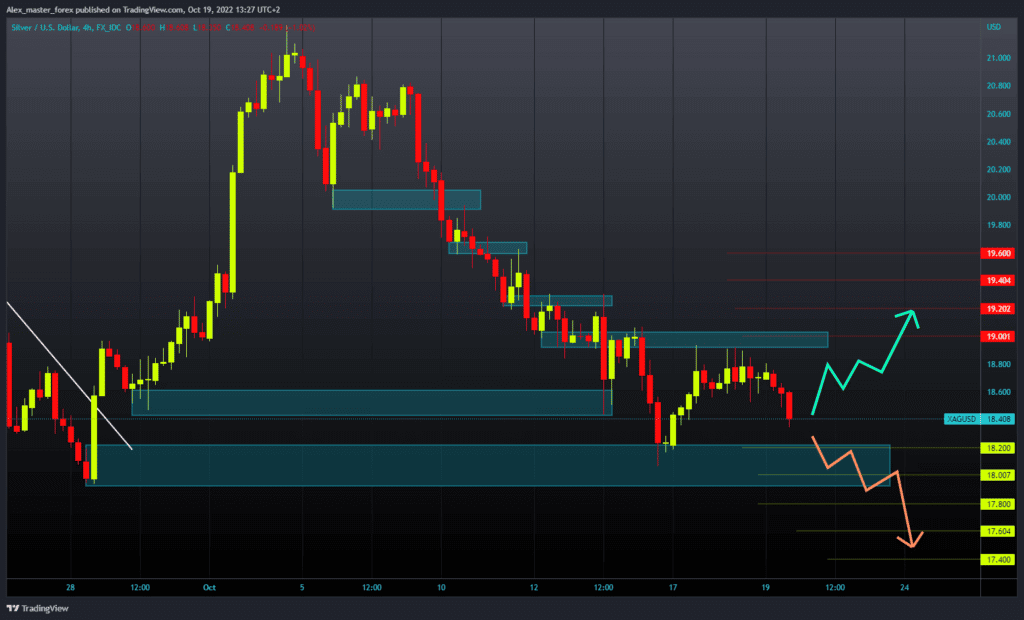
- The price of silver tested the $19.00 level of resistance yesterday, failed to climb above, and turned again on the bearish side.
Gold chart analysis
Today, the price of gold broke through the October support zone and fell to the $1631 level. The dollar started another bullish rally, which affected the price of gold and broke it below the previous support zone. We are now looking at the $1610-1620 support zone from the end of September.
Here we could expect the next stop in the price of gold. To continue the bearish option, we would need a drop below, and with further negative consolidation, the price of gold would probably visit the $1600 level.
For a bullish option, we need a new positive consolidation and a return above the $1640 level. After that, we could expect the price of gold to begin a recovery. Potential higher targets are $1650, $1660 and $1670 levels.

Silver chart analysis
The price of silver tested the $19.00 level of resistance yesterday, failed to climb above, and turned again on the bearish side. During the Asian trading session, the price first fell below $18.80 and soon below the $18.60 level.
The bearish trend continued in the European trading session, and the price fell to $18.38. We could soon test support at $18.20 from Monday. A strong dollar could easily push the price of silver below that level of support, and our target would then be the $18.00 level.
For a bullish option, we need a new positive consolidation and a price return to the $18.80-$19.00 zone. Then we need to hold on there and move above the $19.20 level with a new bullish impulse.
After that, the price would be better positioned to continue its recovery. Potential higher targets are the $19.40 and $19.60 levels.


