


Gold and Silver: Gold is steady above $2030 on Monday
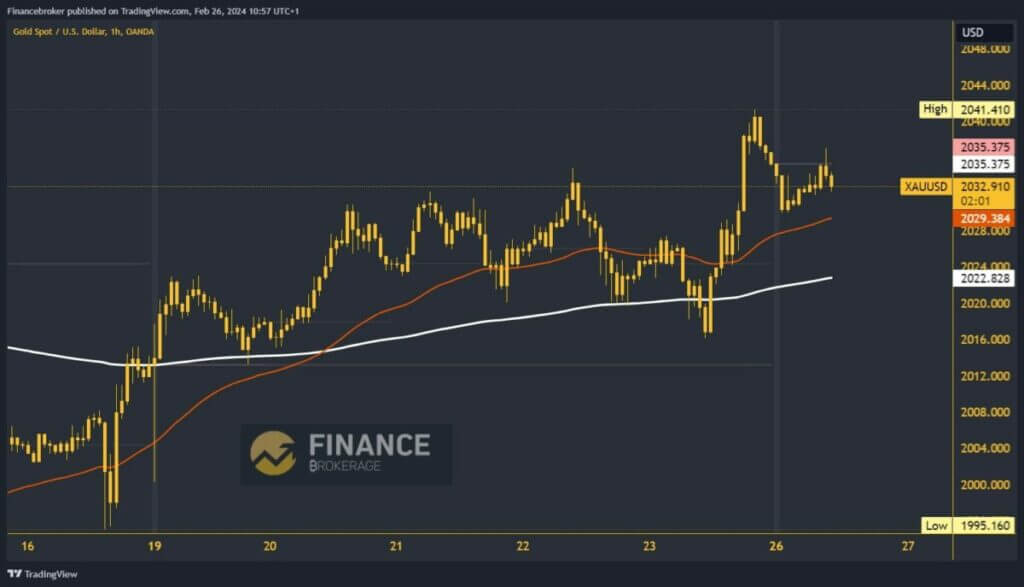
- Last week’s highest gold price was at the $2041 level.
- Since the beginning of the day, the price of silver has been under bearish pressure.
Gold chart analysis
Last week’s highest gold price was at the $2041 level. From that level, we started to pull back to support at the $2030 level. During the Asian trading session, the price managed to start a bullish consolidation and climbed up to the $2037 level. There, we encounter a new resistance and start a pullback, going down to the $2032 level. We now turn to the bearish side and look towards the previous low at the $2030 level.
If we have to retest that support level, prices will be under a lot of pressure to break below and form a new daily low. Potential lower targets are $2026-$202 levels. We will have greater support in the EMA200 moving average in the zone around the $2020 level.

Silver chart analysis
Since the beginning of the day, the price of silver has been under bearish pressure. During the Asian session, the price falls below the $22.95 level, gaining first support at the $22.80 level. We failed to hold above that level and saw a break below in the previous hour. The price falls below the $22.70 level, forming a new daily low and thus confirming bearish momentum.
Potential lower targets are the $22.60 and $22.50 levels. We need a positive consolidation and a return above the $22.85 level for a bullish option. This would bring us back above the support level and the EMA200 moving average. Consolidation above would reinforce optimism in the silver price recovery. Potential higher targets are $23.00 and $23.10 levels. The next stronger resistance zone is at the $23.20 level.


