Gold and Silver: Gold is holding high above $1985 level
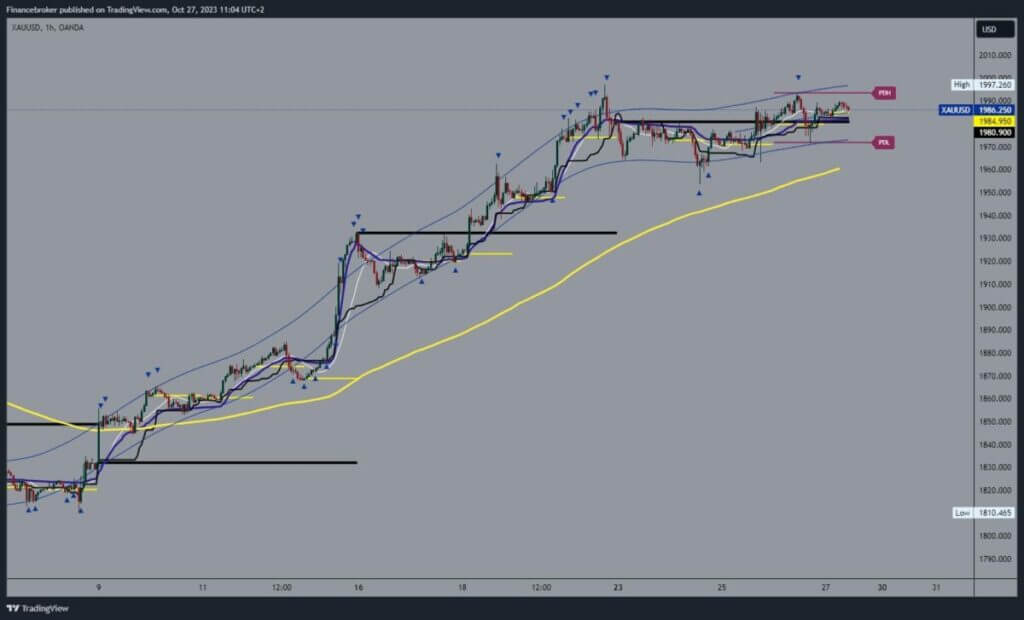
- This week’s gold price movement took place in the $1960-$1995 range.
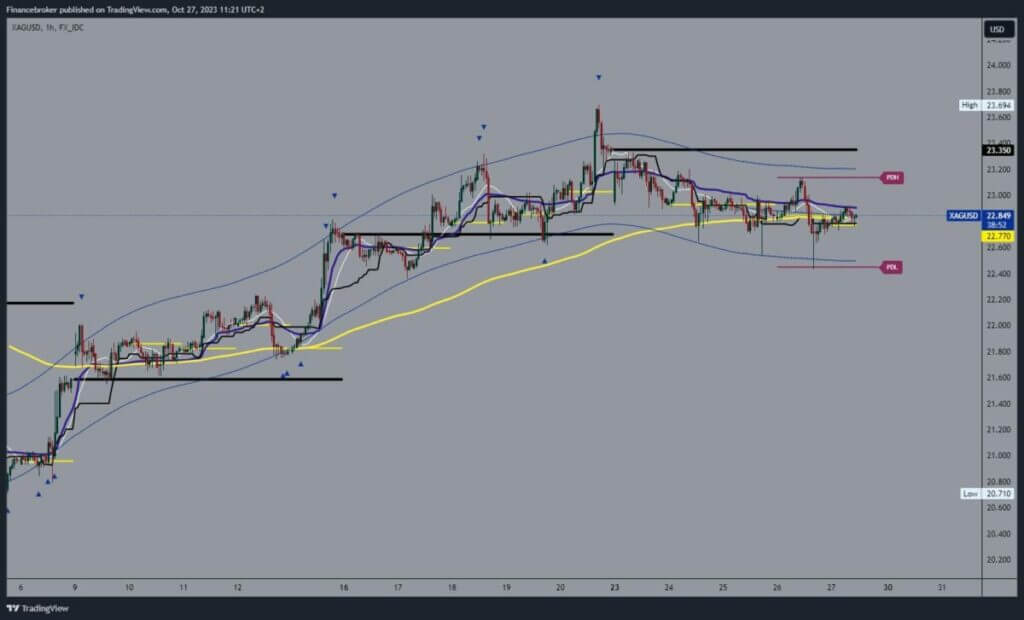
- The price of silver has been in retreat since the beginning of this week.
Gold chart analysis
This week’s gold price movement took place in the $1960-$1995 range. We are currently at the $1986 level and expect to see a continuation of the bullish rally above the $1990 level. It would be nice if we managed to reach the $ 2,000 level at the end of this week.
It would be good to move up to the $1995 level for a bullish option. So we would be close to $2000, and a break above could happen. Potential higher targets are the $2010 and $2020 levels.
We need a negative consolidation and pullback to $1970, yesterday’s support level, for a bearish option. A break below would make us form a new lower low, which would strengthen the bearish option. Potential lower targets are $1960 and $1950 levels. Additional support for the $1960 level is the EMA50 moving average.

Silver chart analysis
The price of silver has been in retreat since the beginning of this week. This week’s high was on Monday at the $23.40 level. After that, the price made a bearish consolidation, and we mostly moved in the $22.60-$23.20 range. Yesterday, we saw a bearish impulse to the $22.40 level, but the price quickly returned above the $22.60. We are now at $22.85 and fighting the EMA50 moving average to get its support.
We need a break above the $23.00 level to eliminate the bearish pressure and continue towards the previous high. Potential higher targets are $23.20 and $23.40 levels. We need a negative consolidation and pullback to the $22.60 support level for a bearish option. A drop below would indicate that we are on track to go even lower. Potential lower targets are $22.40 and $22.20 levels.


