Gold and Silver: Gold finds support at the $1920 level
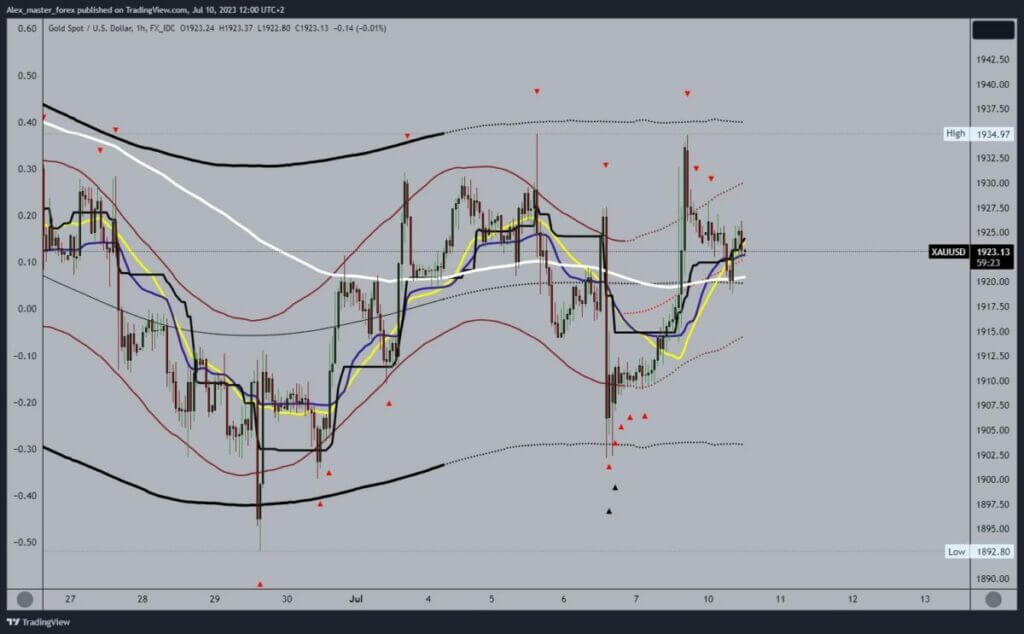
- The price of gold rose to the June high of $1935 on Friday.
- On Friday, the price of silver returned above the $23.00 level after falling the day before to the $22.50 level.
Gold chart analysis
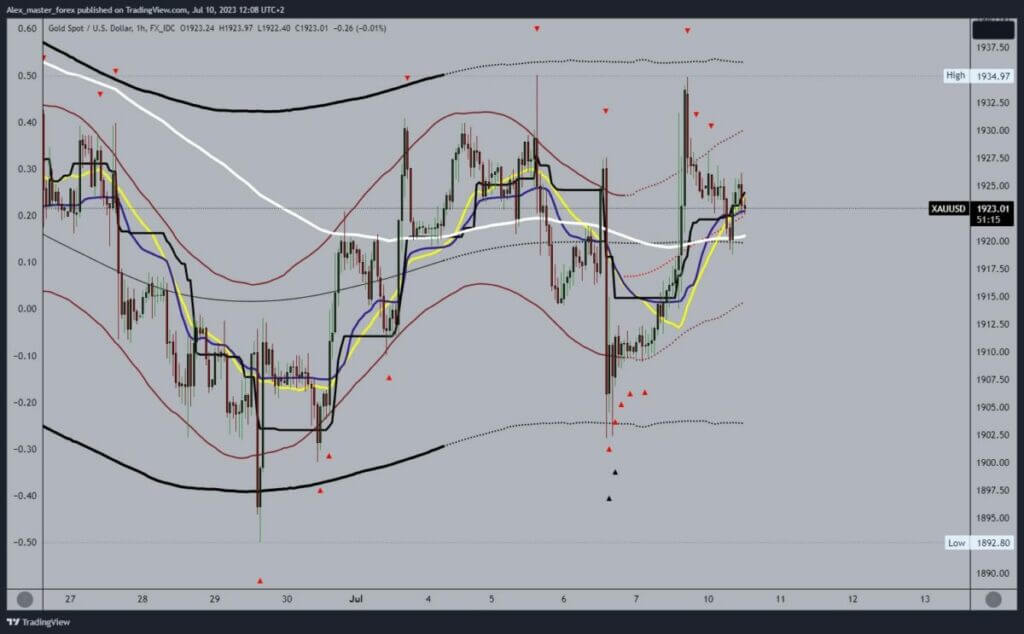
The price of gold rose to the June high of $1935 on Friday. We have been trying to break above for two months this month, and it ended in failure. And this time, the price of gold started a new pullback. We get support at the $1920 level during the Asian session. Additional support is the EMA50 moving average. After that, the price makes a small recovery to the $1925 level, where we encounter today’s resistance.
We need a positive consolidation above the $1925 level for a bullish option. Then we could expect to see further recovery, and the potential higher targets are the $1930 and $1935 levels. We need a negative consolidation and pullback below the EMA50 and the $1920 support level for a bearish option. Potential lower targets are $1915 and $1910 levels.

Silver chart analysis
On Friday, the price of silver returned above the $23.00 level after falling the day before to the $22.50 level. During the Asian trading session, the price of silver managed to maintain around the $23.00 level. In the zone around the $22.90 level, we have support in the EMA50 moving average, which could help us initiate further recovery.
The first step is to reach the $23.20 level and try to hold up there. Then we need a break above and a continuation of the bullish consolidation. Potential higher targets are $23.30 and $23.40 levels. We need a negative consolidation and a price drop below $22.90 for a bearish option and the EMA50 moving average. That picture would further weigh on the price of silver and send it even lower. Potential lower targets are $22.70 and $22.60 levels.


